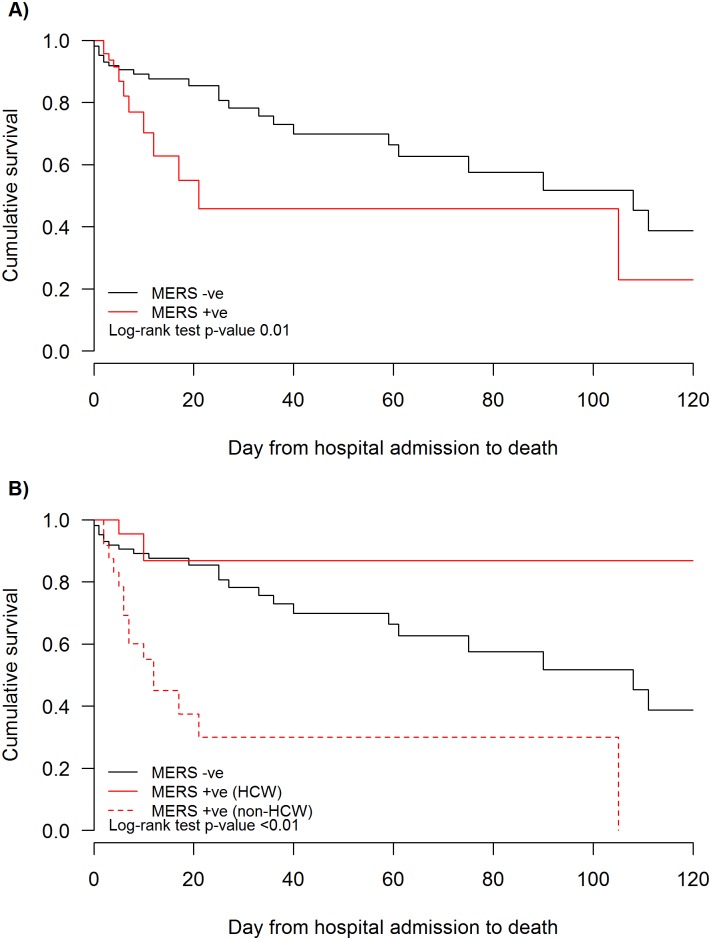
Fig 1. Time from hospital admission to death.
A: Comparing patients with MERS-CoV infection (red line) and those negative for MERS-CoV (black line) (p = 0.01). B: Comparing health care workers with MERS CoV (red dotted line; group1), non-HCW with MERS (red solid line; group 2) and patients without MERS-CoV infection (black solid line; group 3). Log rank test group 1 vs. group 2 p = 0.003; group 2 vs group 3 p = 0.45; group 1 vs group 3 p<0.001.

