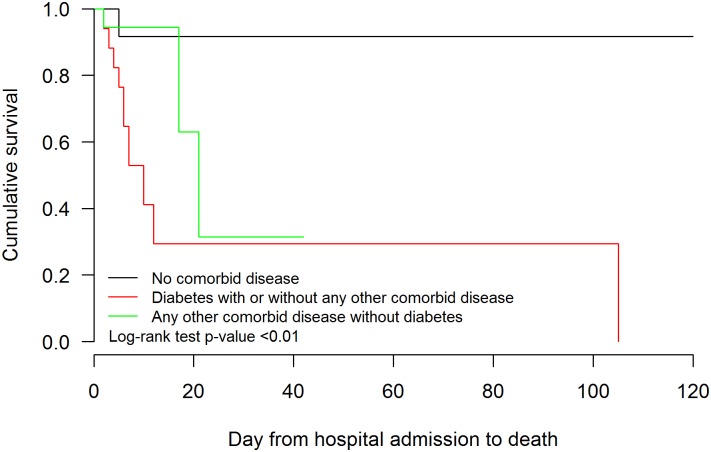
Fig 2. Time from hospital admission to death stratified by comorbid disease status among MERS positive cases.
Survival analysis was carried out to ascertain impact of co-morbidities on survival in patients with MERS-CoV infection. Black line (group 1): No comorbid disease; Red line (group 2): Diabetes with or without other comorbidities; Green line (group 3): Any other comorbid disease without diabetes. Log rank test: group 1 vs group 2 p = 0.01; Group 1 vs. group 3 p = 0.54; group 2 vs. group 3 p = 0.01.

