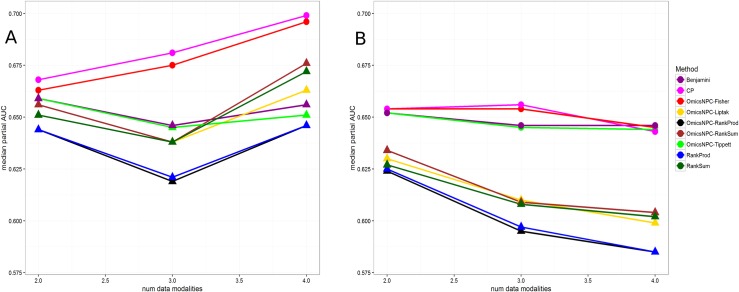
Fig 4. Median pAUCs in relation to the number of modalities analysed in the different modalities scenario.
Each line corresponds to a specific method. The x axis represents the number of modalities analysed, and the y axis the median pAUCs. Circles suggest that the observed differences from the best method were not statistically significant at level ≤ 0.05. A) Only genes which exhibited the same behaviour across all datasets were taken into account. In this experiment only the integrative approaches were evaluated. CP and omicsNPCFisher were the best method in all cases. B) All genes were considered in this analysis. omicsNPCTippett, omicsNPCFisher, CP and Benjamini achieved better performance than other methods.

