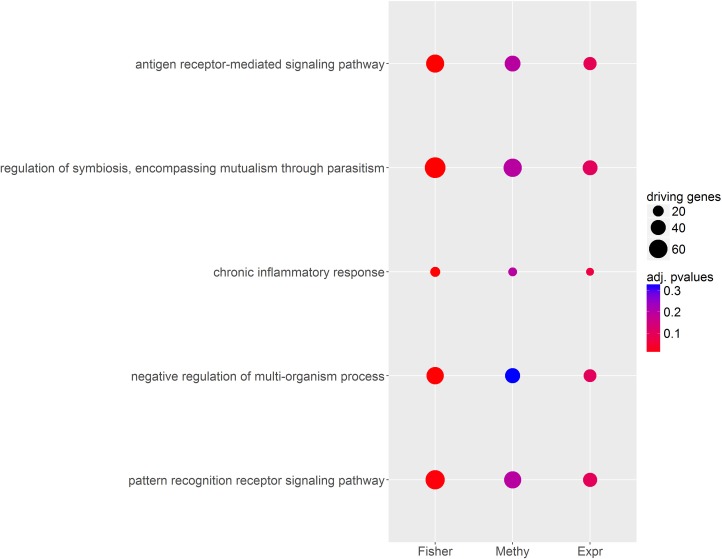
Fig 6. Pathway enrichment analysis in the Schizophrenia case-study.
Some pathways are enriched according to omicsNPC (Fisher combining function) but not for the single-dataset analysis (FDR level 0.05 in all cases); the 5 most enriched of such pathways are reported on the y-axis. Each dot represents the significance (color) and number of deregulated genes (size) in the respective pathway according to omicsNPCFisher (Fisher), methylation (Methy), or transcriptomics data (Expr).

