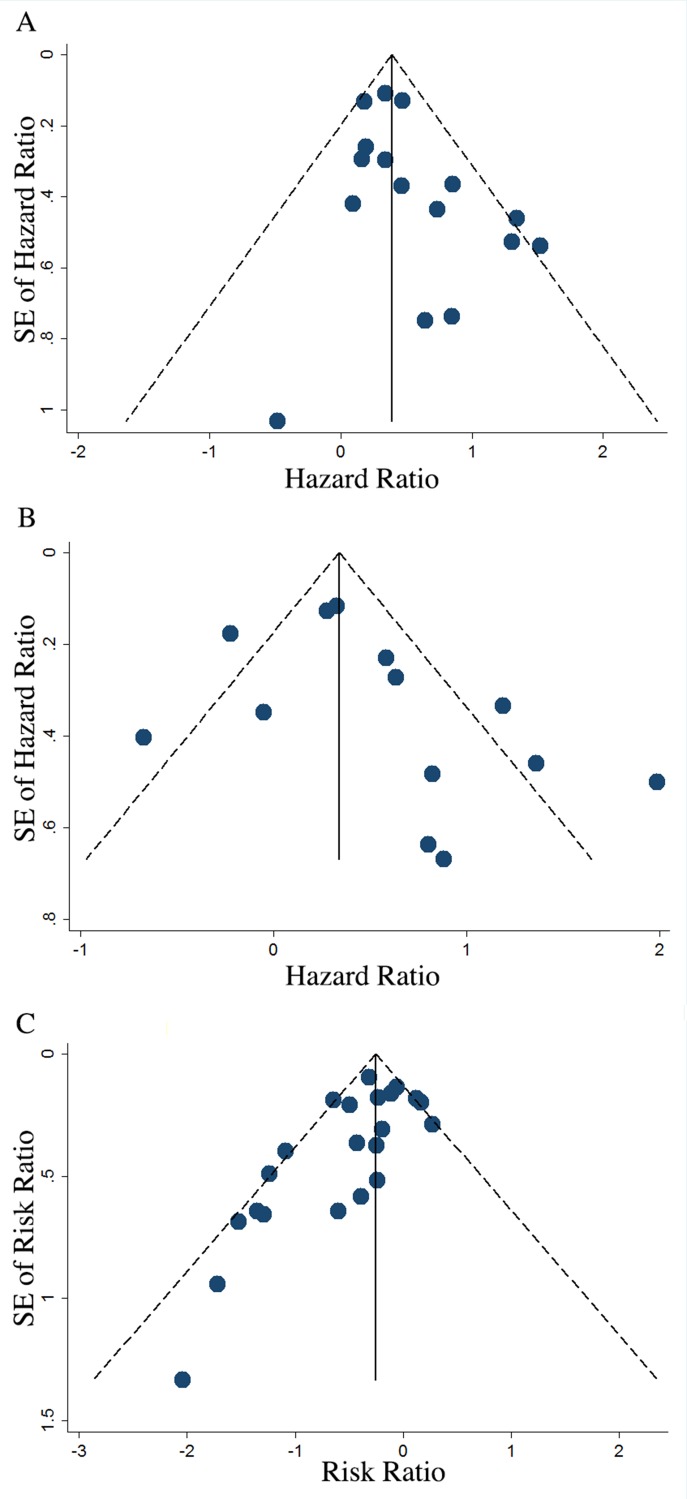
Fig 11. Funnel plots presenting prognostic value of ABCB1 for OS, PFS and TR.
OS = overall survival; PFS = progression free survival; TR = total response rate. A, funnel plots showing the distribution of effect size and prevision of individual study estimate when evaluating the summary HR for OS. Egger’s test: P = 0.078. B, funnel plots showing the distribution of effect size and prevision of individual study estimate when evaluating the summary HR for PFS. Egger’s test: P = 0.146. C, funnel plots showing the distribution of effect size and prevision of individual study estimate when evaluating the summary RR for TR. Egger’s test: P = 0.019.

