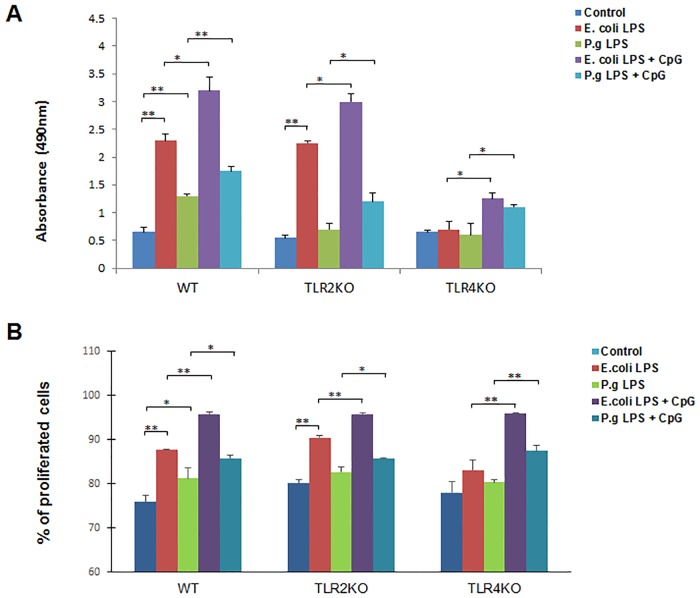
Fig 1. B cell proliferation after E. coli LPS, P. gingivalis LPS and CpG-ODN treatment.
Splenocyte B cells were separated from WT, TLR2 KO and TLR4 KO mice and cultured 48 hours with E. coli LPS (10μg/ml), P. gingivalis LPS (10μg/ml), E. coli LPS (10μg/ml) + CpG (10μM), and P. gingivalis LPS (10μg/ml) + CpG (10μM). Viable cells quantities were measured by absorbance at 490 nm reading from each group of WT, TLR2 KO and TLR4 KO mice respectively (A) (mean±SE, n = 6, *p<0.05, **p<0.01). Proliferation cells quantities were also measured by CellTrace CSFE staining and presented as percentages of total cells (B). (mean±SE, n = 3, *p<0.05, **p<0.01).

