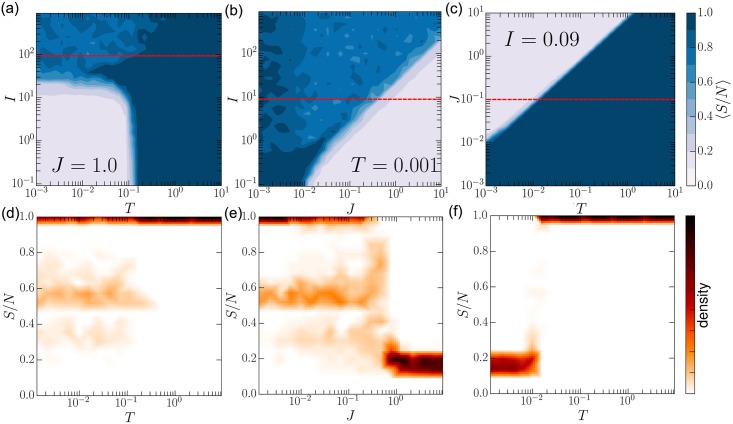
Fig 2. Phase space.
(a-c) Phase diagrams of various combinations of the three parameters J, I, and T. Along with corresponding slices through the phase space as indicated by the dashed red lines (bottom row). (a,d) peer-influence I and susceptibility T conflict creating a regime where multiple belief systems with various coherences can coexist. We see a similar regime appear in (b, e) where peer-influence and coherentism contend for dominance. More traditional disorder-to-order transitions as in other opinion models also take place when I is small and fixed (c, f). S/N is the fractional size of the largest group. ER graphs with N = 104 nodes and average degree of 5 were used. The density was calculated from a 160 trails per point. The belief network was fully connected with M = 5.

