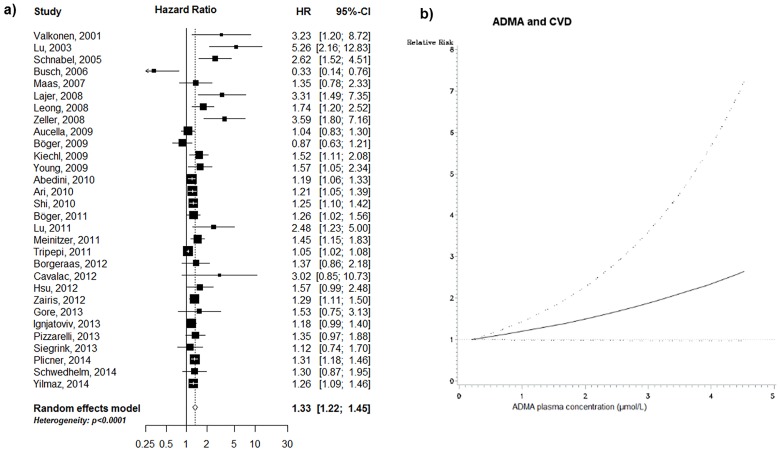
Fig 2. ADMA and CVD: a) high versus low analysis, and b) non-linear dose-response analysis (based on 10 studies, p for non-linearity = 0.370).
Black square: point estimate for individual study; horizontal line: 95% CI for observed effect in each study; diamond: pooled estimate and 95% CI for meta-analysis. Random-effects estimate (DerSimonian and Laird method).

