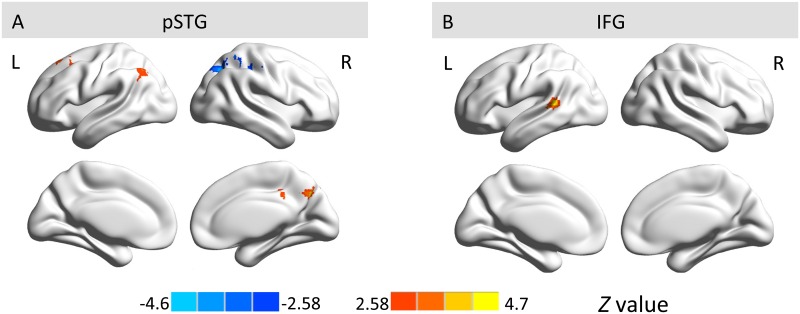
Fig 6. Group comparison of hemispheric asymmetry between 3- and 5-year-olds for pSTG (A) and IFG (B).
The red-yellow color bar indicates regions with stronger functional asymmetry in 5-year-olds than 3-year-olds, while the blue color bar indicates regions with stronger functional asymmetry in 3-year-olds than 5-year-olds. L, left hemisphere; R, right hemisphere.

