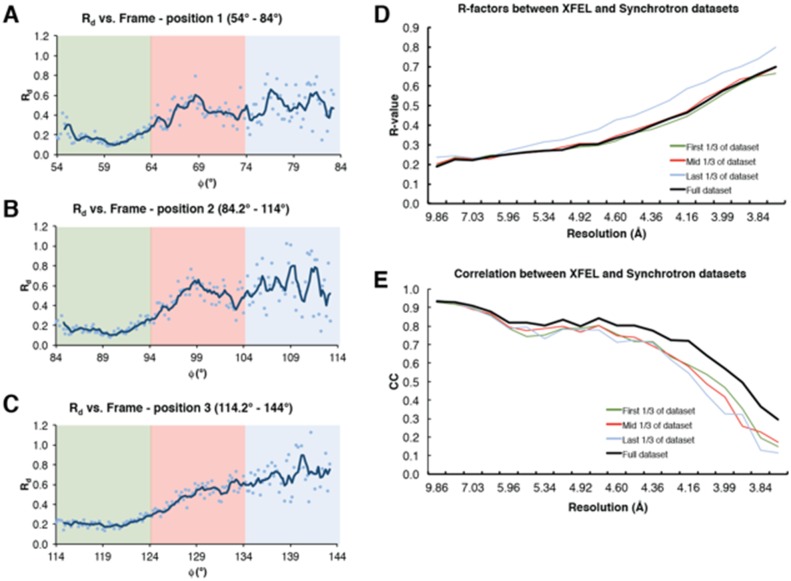
Author response image 2. Analysis of radiation damage effect on synchrotron diffraction data.
(A–C) Rd plot vs. Φ angle for diffraction data collected at three separate positions on the same Syt1-SNARE crystal. Colored boxes represent sub-datasets (green – first 1/3 of the dataset, red – mid 1/3 of the dataset, blue – last 1/3 of the dataset). (D) R-factors between the full XFEL diffraction dataset and the three synchrotron sub-datasets; (E) Correlation coefficients between the two datasets. The colors for (D) and (E) follow the same scheme as that of (A–C); the full synchrotron dataset is shown as a black line.

