. 2016 Nov 3;13:E152. doi: 10.5888/pcd13.160212

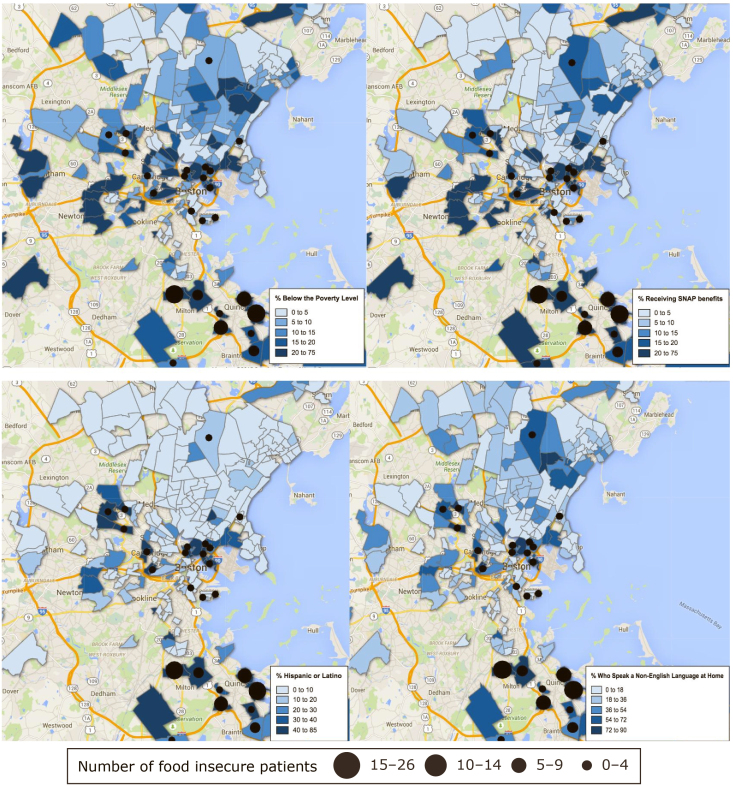
Figure 1.

Figure 1 shows intensity maps of sociodemographic variables at the census tract level, with overlapping data on the number of food insecure patients residing in each census tract. Map shows Boston metropolitan area, with census tracts in which patients of the clinics reside noted to indicate how many patients from the clinic reside in the census tract. The map indicates areas if increased concentration of poverty, SNAP receipt, Hispanic or Latino ethnicity, and speaking a language other than English at home.

Intensity maps of sociodemographic variables at the census tract level with overlapping data on the number of food insecure women residing in each census tract, Boston metropolitan area, 2013–2015. Abbreviation: SNAP, Supplemental Nutrition Assistance Program.