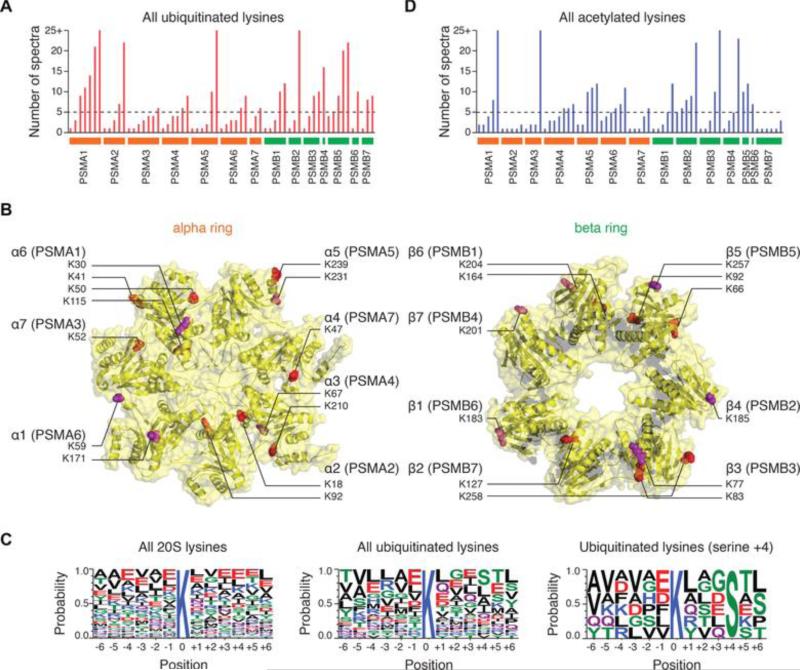
Figure 1. Ubiquitination of cardiac 20S proteasomes.
(A) The number of identified ubiquitinated lysine in each 20S proteasome subunit is shown. The dashed line represents the spectrum count cutoff for the stringency filter. A modification site is only accepted if identified in ≥ 2 subjects and ≥ 5 independent spectra. (B) The location of the identified lysine ubiquitination sites in 20S proteasome (Protein Data Bank structure 1IRU) alpha and beta subunits. Red-colored residues represent ubiquitination sites; purple residues are ubiquitinated and acetylated. (C) Compared to the aligned sequences around all 20S proteasome lysine positions (left), the ubiquitinated lysines (middle) show a slight enrichment of serine in the +4 position (right). (D) The number of identified acetylated lysine in each 20S proteasome subunit is shown.

