
Figure 4.
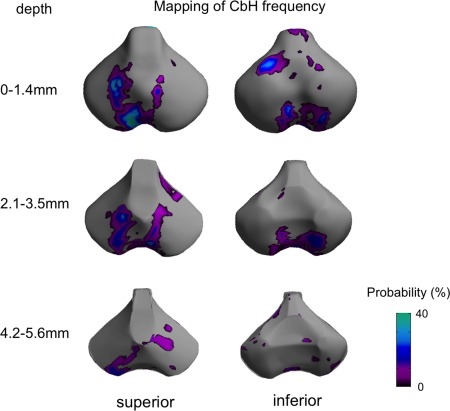
Mapping of frequency of individual cerebellar hemorrhage (CbH). Volumes of the CbH graded 2 or higher are labeled and projected on to the surface sampled at every 0.7 mm (=size of a voxel) in depth from the original surface. For each individual the union was obtained between 0 and 1.4 mm, between 2.1 and 3.5 mm and between 4.2 and 5.6 mm. Shown are the frequencies of the projection of CbH in %. The CbH primarily distributes within superficial zones (0–3.5 mm) and the pattern largely overlaps with the pattern of growth impairment related to CbH shown in Figure 3B. [Color figure can be viewed in the online issue, which is available at http://wileyonlinelibrary.com.]