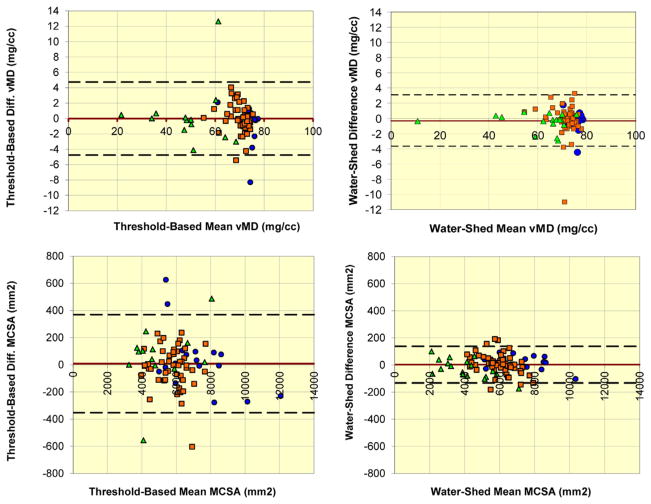
Fig. 5.
Test-retest discrepancies within each method. Bland-Altman plots of test-retest differences for MD (top row) and MCSA (bottom row) within each of threshold-based segmentation (left column) and watershed algorithm-guided manual segmentation (right column). Green triangles = spinal cord injury adults, orange squares = older adults, and blue circles = younger adults. Upper and lower dashed lines indicate Bland-Altman 95% limits of agreement. Red line indicates mean of differences between test and retest values. MCSA, muscle cross-sectional area; MD, muscle density. (For interpretation of references to color in this figure legend, the reader is referred to the web version of this article.)

