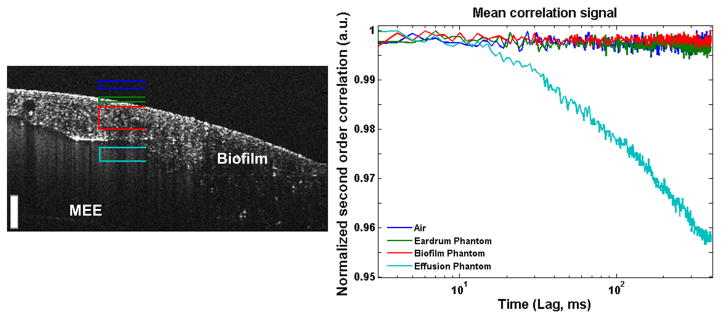
Fig. 4.
Results of testing the feasibility of the proposed method for non-invasive characterization of MEEs in a middle ear phantom. Different depth ranges corresponding to air above the phantom (Dark Blue), simulated TM (Green), simulated biofilm (Red), and simulated effusion (Teal) were analyzed using the proposed technique. As expected, only the simulated effusion provides a meaningful decay curve (right). Scale bar is 100 micron in depth.

