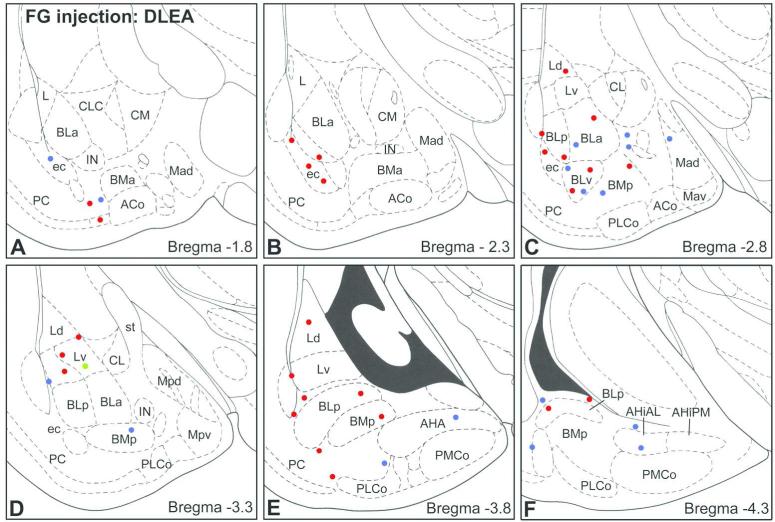
Fig. 10.
Sections arranged from rostral (A) to caudal (F) depicting the locations of FG+ neurons in the amygdala co-expressing SOM and NPY (red dots), expressing SOM but not NPY (blue dots), or expressing NPY but not SOM (green dot) in with a FG injection into DLEA. Each bregma level shows the locations of neurons plotted from two non-adjacent 50 μm-thick sections at this level; each dot represents one neuron. Templates are modified from the atlas by Paxinos and Watson (1997). Modified from McDonald and Zaric, 2015a.

