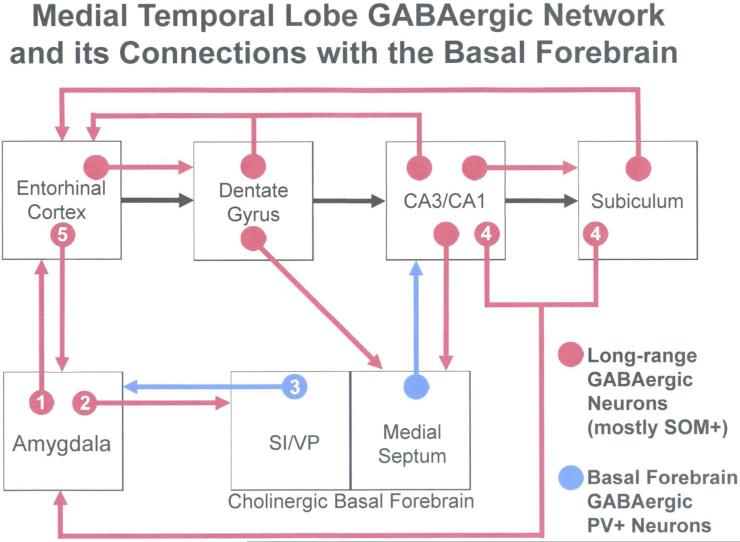
Fig. 11.
Schematic diagram illustrating interconnections between the amygdala, hippocampal/parahippocampal areas, and basal forebrain that are mediated in part by GABAergic projection neurons, most of which also express SOM (shown in red). The series of glutamatergic projections starting at the entorhinal cortex and extending through the hippocampal formation, including the “trisynaptic circuit”, are indicated by black arrows (all other glutamatergic projections are not shown). GABAergic projections from the basal forebrain to the amygdala (from the substantia innominata and ventral pallidal regions; SI/VP) and hippocampus (from the medial septum) are shown in blue; these neurons also express PV. Numbers in the connections of the amygdala refer to the following studies: (1) McDonald and Zaric, 2015a; (2) McDonald et al., 2012; (3) Mascagni and McDonald, 2009 and McDonald et al., 2011; (4) Müller et al., 2012; (5) McDonald and Zaric, 2015b. See reviews by Jinno (2009) and Caputi and coworkers (2013) for the studies demonstrating the connections that are not designated by numbers. Modified from McDonald and Zaric, 2015b.

