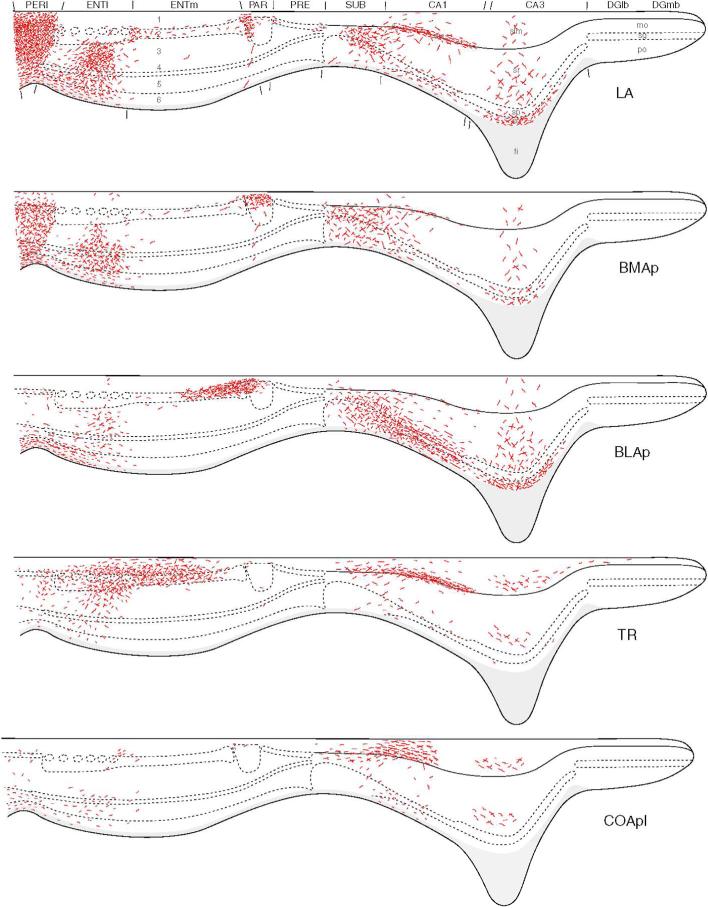
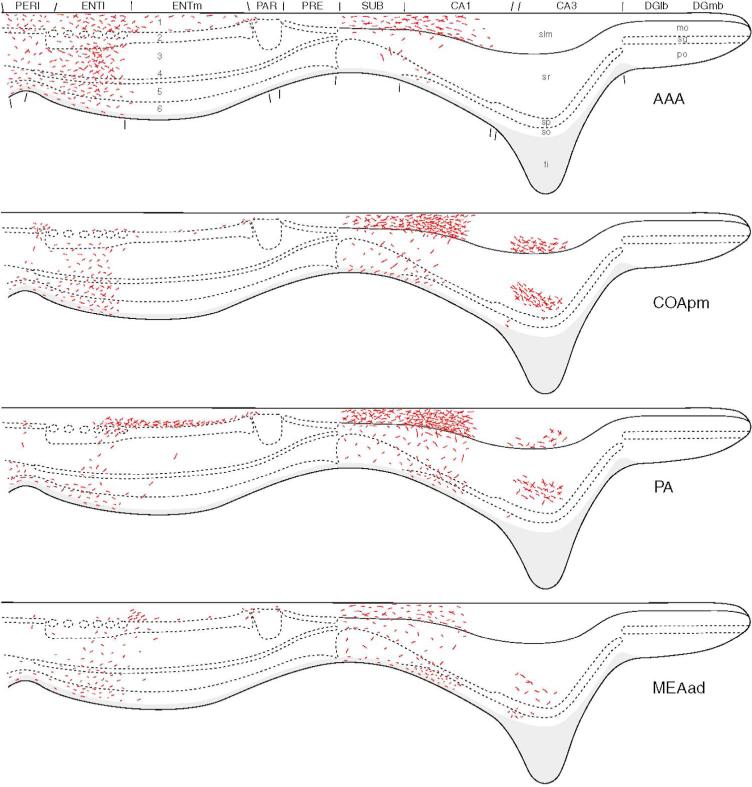
Fig. 6.
Summary of the laminar distributions of amygdalar inputs (red) to the hippocampal region based on the results of PHA-L anterograde tracing studies. The findings are illustrated on an idealized section through an unfolded “flatmap” of the hippocampal region (see Petrovich et al., 2001, for details). The nomenclature used to denote the amygdalar nuclei is that used by Swanson (2004) (see Table 1). The postpiriform transition area, TR, corresponds to APIR of Paxinos and Watson (1997). Reproduced from Petrovich et al, 2001.


