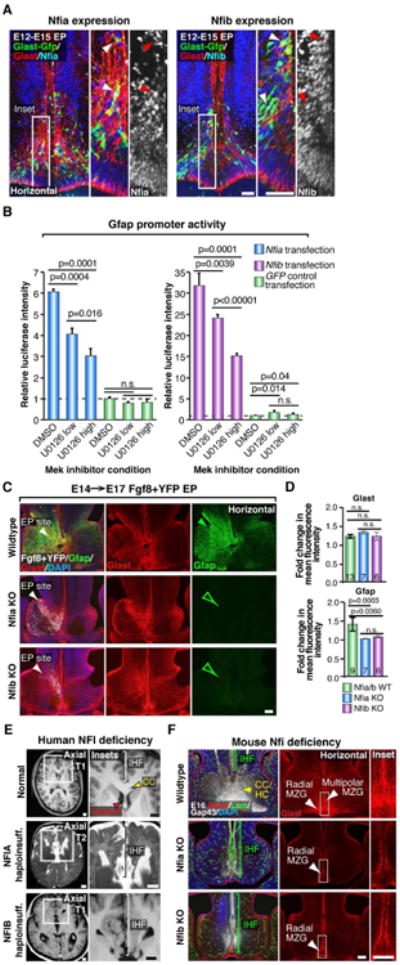
Figure 6. Nfia and Nfib are downstream transcriptional effectors of Fgf8 signaling required for IHF remodeling and corpus callosum formation.

(A) E12→E15 in utero electroporation (EP) of the mouse telencephalic hinge with piggyBac Glast transposase/GFP (green) reporter plasmids, colabeled with Glast (red) and either Nfia or Nfib (blue/white) demonstrates Nfia and Nfib are both expressed by radial MZG (arrowheads). (B) Luciferase activity of U251 cells cotransfected with a Gfap promoter luciferase construct and either Nfia, Nfib or GFP control expression constructs, following addition of the Mek inhibitor U0126 (low = 5 μM; high = 20 μM), performed in triplicate. Data are represented as mean luciferase intensity ± SD, normalized to the GFP DMSO control (dotted line) and are representative of at least 2 independent experiments. Significant differences were determined with a Student's t-test. (C) Unilateral E14→E17 EP of Fgf8 + YFP plasmids into Nfia and Nfib knockout (Nfi KO) mice and their wildtype littermates, followed by fluorescence immunohistochemistry for Gfap (green) and Glast (red). Note increase in Gfap expression in wildtypes (closed green arrowhead) and absence of Gfap expression in Nfi KO mice (open green arrowheads). (D) Quantification of the fold change in Gfap and Glast fluorescence intensity. Data are represented as means ± SEM (n-values within bars, significant differences determined with a non-parametric Mann-Whitney test). (E) Coronal and axial structural T1- and T2-weighted MRI images of a normal human brain compared with NFIA- and NFIB-haploinsufficient individuals. Brackets indicate interhemispheric fissure (IHF) length and red arrowheads indicate the separated septum in NFI haploinsufficient brains. (F) Fluorescence immunohistochemistry for Glast (red), Laminin (green) and Gap43 (white) in Nfia and Nfib KO embryos and wildtype littermates at E16. Brackets indicate IHF length and white arrowheads indicate the distribution of radial versus multipolar MZG cells. Yellow arrowhead indicates the callosal (CC) and hippocampal commissural (HC) tract in wildtypes. Scale bars, 50μm (A), 100 μm (C and F) and 1 cm (E). See also Figure S5.
