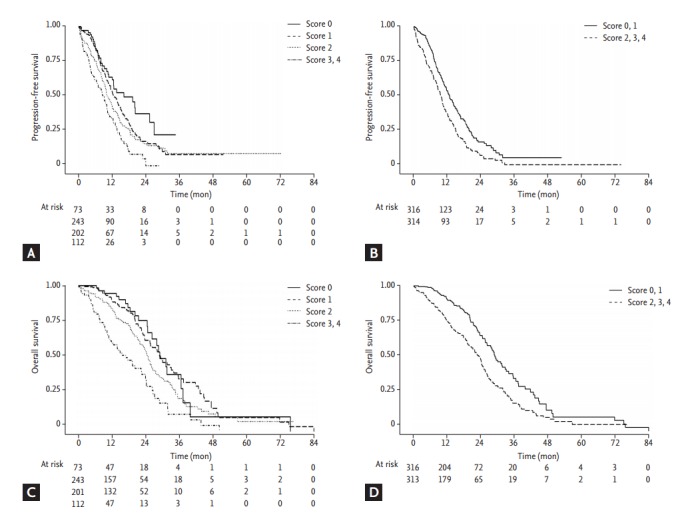
Figure 2.

Kaplan-Meier curves of progression free survival (PFS) and overall survival (OS) by sum of score and by group with sum of score 0, 1 and group with 2, 3, 4. (A) PFS curve plotted by sum of score. (B) PFS curve plotted by group with sum of score 0, 1 and group with 2, 3, 4. (C) OS curve plotted by sum of score. (D) OS curve plotted by group with sum of score 0, 1 and group with 2, 3, 4.
