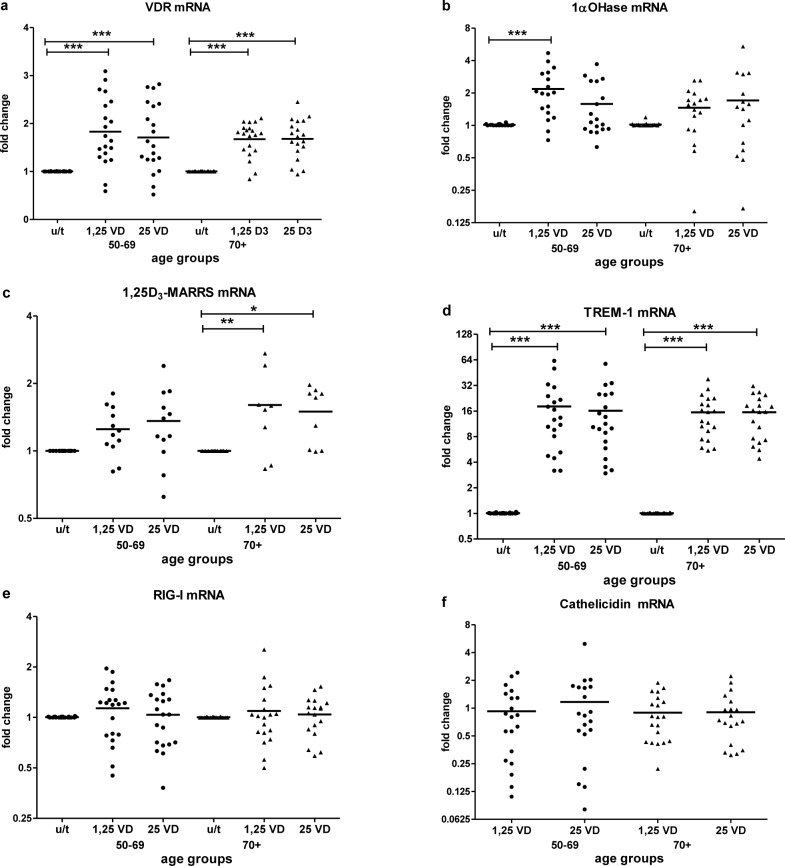
Figure 3. Vitamin D-induced mRNA expression by age.
The response to vitamin D stimulation by age group was determined by fold change in VDR a., 1aOHase b., 1,25D3-MARRS c., TREM-1 d. and RIG-I e. mRNA expression after in vitro treatment of PBMCs with active 1,25(OH)2D3 or inactive 25(OH)D3 compared to untreated PBMCs. Cathelicidin f. mRNA expression was measured in vitamin D-treated samples and compared to expression in a calibrator sample (vitamin D treated random PBMCs) due to Cathelicidin mRNA at baseline was below the limit of detection. Gene expression was assessed by RT-qPCR. All assays were done in duplicate and expression was normalized to β-actin. The relative amount of target gene in each sample was estimated using the 2−ΔΔCT method as described elsewhere [49]. The mean of the values is represented by the horizontal line.u/t: untreated PBMCs; 1,25 VD: PBMCs treated with 1,25(OH)2D3; 25VD: PBMCs treated with 25 (OH)D3. Statistical analysis was performed by ANOVA (* p < 0.05**, p < 0.01, *** p < 0.001).

