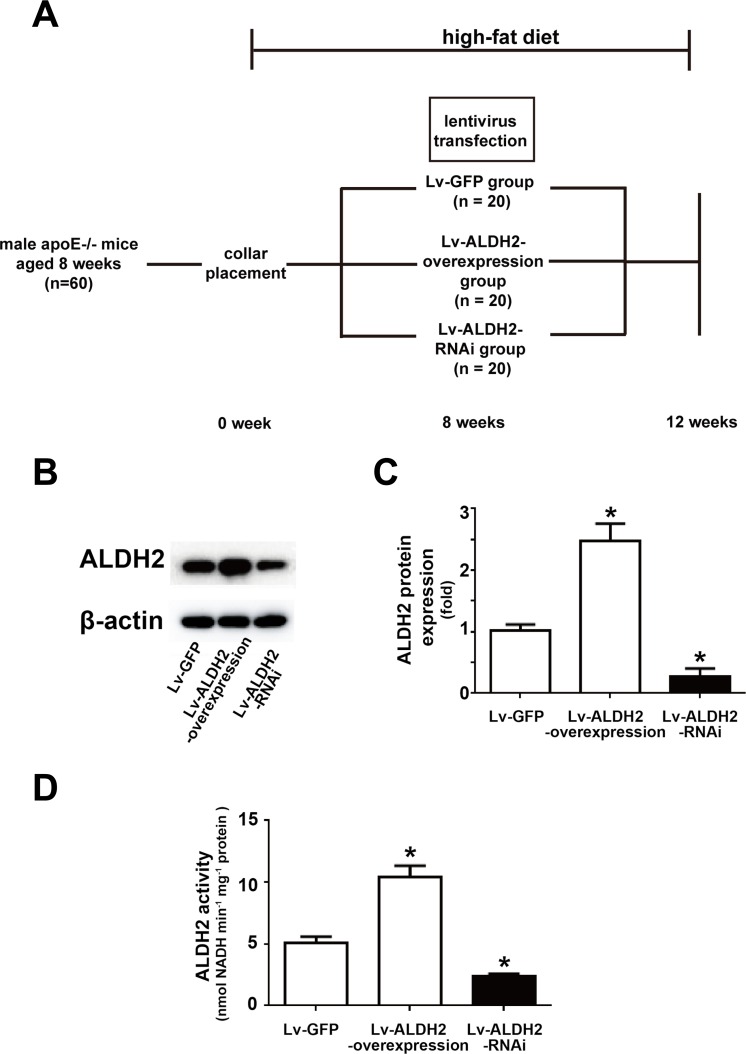
Figure 1. Time line, grouping and ALDH2 expression after lentivirus transfection in apoE−/− mice.
A. Time line and grouping of the mice experiment. B. Representative blot of ALDH2 protein expression in three groups of the apoE−/− mice. C. Statistical analysis of relative ALDH2 expression in three groups. D. Histograms of ALDH2 activity in three groups. All data were showed as mean±SEM. *: P < 0.05 vs Lv-GFP group.

