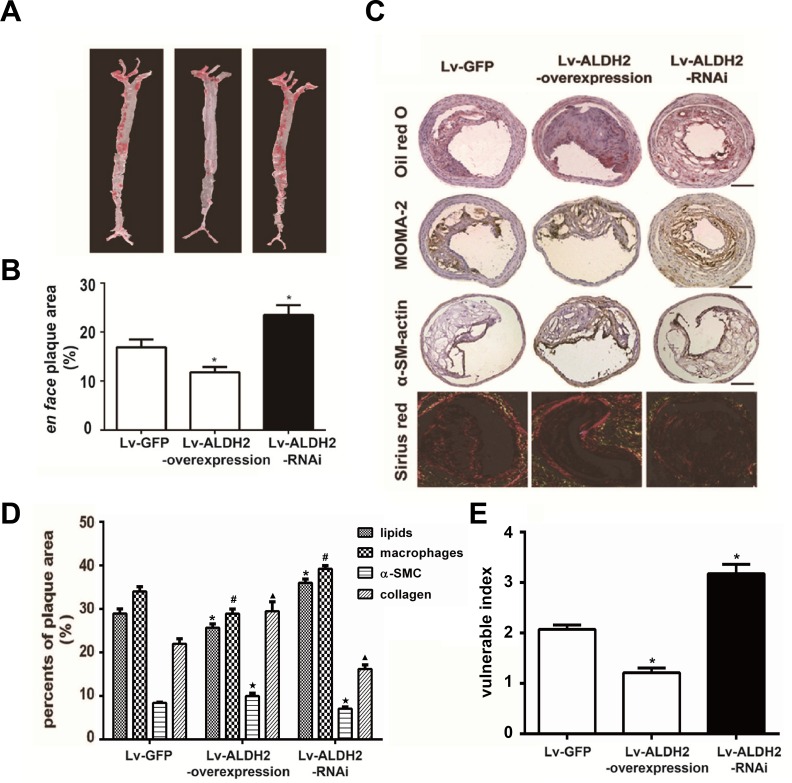
Figure 2. Changes of atherosclerotic plaques in aortas and carotid plaques composition in apoE−/− mice after lentivirus transfection.
A. Representative en face photographs of aortas in three groups showing oil red O-stained atherosclerotic plaques. B. Quantitative measurement of en face plaque area (%) in the whole aorta. *: P < 0.05 vs Lv-GFP group. C. Representative Oil-red O staining, MOMA-2 immunostaining, α-SM-actin immunostaining and Sirius-red staining in three groups of the apoE−/− mice; the bars represent 100μm. D. Column graph of quantification of staining results in Figure 2C by Image-Pro Plus 6.0 Software. *, #, ★, ▴: P < 0.05, percent of lipids, macrophages, α-SMCs and collagen compared with Lv-GFP group, respectively. All data were presented as mean±SEM. E. Bar chart of vulnerable index in three groups of the apoE−/− mice. The vulnerability indexs in the Lv-GFP, Lv-ALDH2-overexpression and Lv-ALDH2-RNAi groups are 2.10±0.10, 1.40±0.10 and 3.20±0.19, respectively. *: P < 0.05 vs Lv-GFP group.

