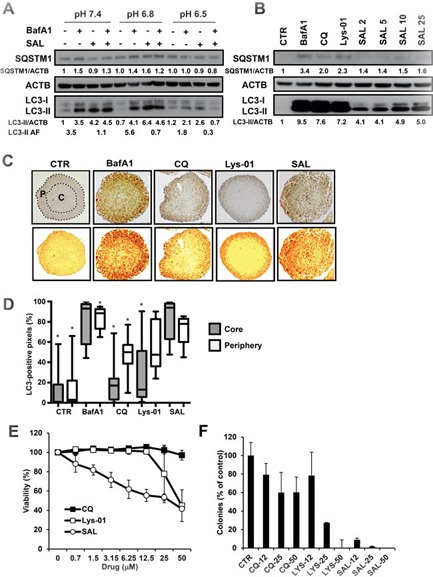
Figure 3. Effects of SAL on HCT116 cells at pH 6.5 and in multicellular spheroids.

A. HCT116 cells were exposed to medium at pH 7.4, pH 6.8 and pH 6.5 overnight. SAL (2 μM) was added to cells for 6 hours, with or without BafA1 (100 nM) during the last 2 hours. The picture shows one representative WB analysis of three independent experiments. B. MCS derived from HCT116 cells were treated for 24 hours with different autophagy inhibitors (50 nM BafA1, 50 μM CQ and Lys-01) and SAL at different concentrations (μM). WB analysis on cell lysates was performed to analyse the expression of LC3-II and a representative WB from three different experiments is shown. C.-D. HCT116 MCS (n = 24) were treated with different autophagy inhibitors for 24 hours and analysed by IHC to detect the distribution of the augmented LC3 expression. LC3 positive pixel analysis was performed in the peripheral (P) and core (C) regions of the MCS as indicated for one representative untreated MCS. Data are shown as box plots, normalised and expressed as percentage of the total number of pixels in the specific area. The * indicates a P < 0.05 for differences between SAL and all treatment groups, calculated by the Mann-Whitney test. E. HCT116 MCS were treated for 3 days with different concentrations of CQ, Lys-01 and SAL. Cell viability was determined with the acid phosphatase assay. F. HCT116 MCS were treated for 3 days with different concentrations of CQ, Lys-01 and SAL. Single cell suspensions were obtained from MCS and clonogenic survival assay was performed. Experiments in E-F were repeated three times and means and SD are shown.
