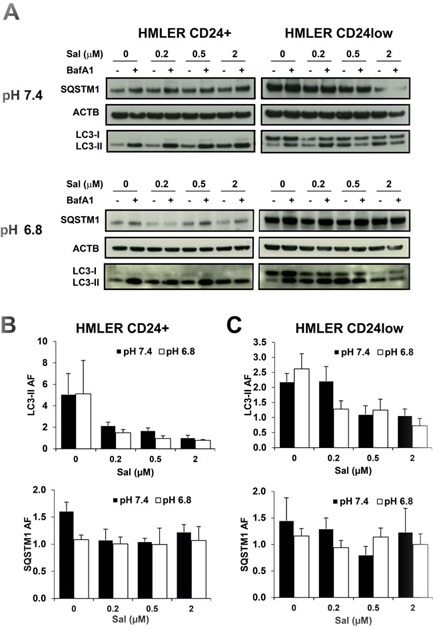
Figure 5. Effects of SAL on autophagy in HMLER cells by western blot.

A. HMLER CD24+ and CD24low cells were plated and cultured with medium buffered at pH 7.4 or pH 6.8 overnight. SAL (μM) was added at different concentrations for 6 hours, with or without BafA1 (100 nM) during the last 2 hours incubation. The picture shows one representative WB analysis of four different experiments. Quantification of LC3-II and SQSTM1 is shown in panel B. for CD24+ cells and panel C. for CD24low cells and data are expressed as mean and SE from four independent experiments.
