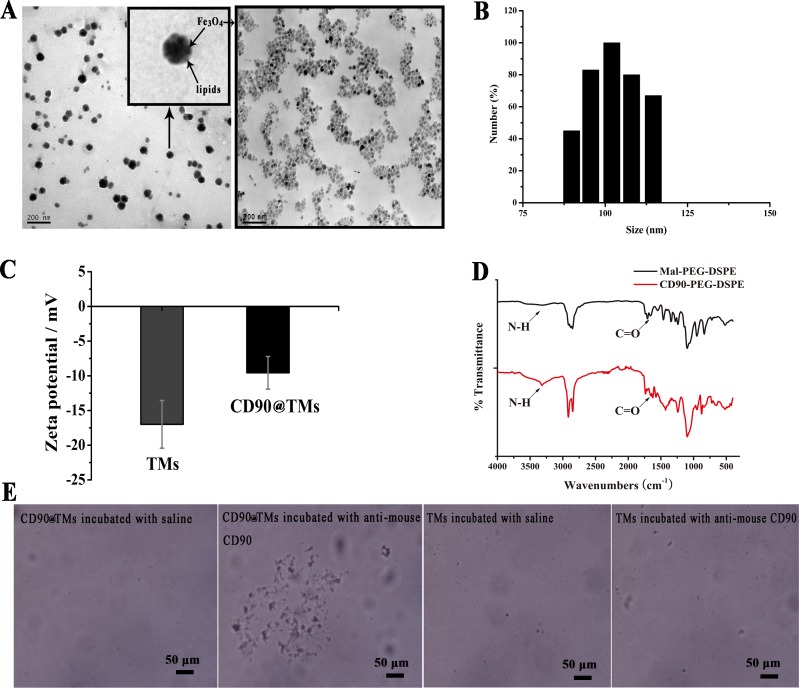
Figure 1. Characterization of CD90@TMs.
A. TEM image of Fe3O4 and CD90@TMs (The bar = 200 nm). B. Liposomes size determined by ZetaPlus. C. Zeta potentials determined by ZetaPlus (mean ± SD, n = 3). D. FTIR spectra of Mal-PEG2000-DSPE and CD90-PEG2000-DSPE. E. The slide agglutination method of CD90@TMs (The bar = 50μm). Abbreviations: TEM, transmission electron microscope; TMs, thermosensitive magnetoliposomes; FTIR, fourier translation infrared spectroscopy; PEG2000-DSPE, 1,2-distearoyl-sn-glycero-3-phosphoethanolamine-N-[methoxy(polyethylene glycol)-2000]; CD90, cluster of differentiation 90.

