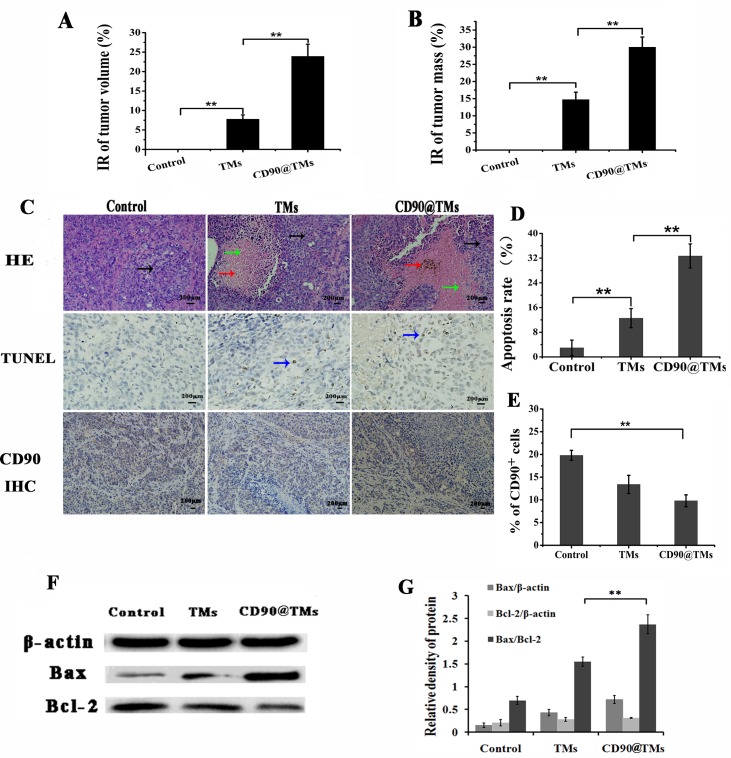
Figure 10. Effect of targeted hyperthermia on CD90+ LCSCs bearing mice.
A. Inhibition rate of tumor volume in different experimental groups (mean ± SD, n = 6). B. Inhibition rate of tumor mass in different experimental groups (mean ± SD, n = 6). C. Tumor tissues of CD90+ LCSCs-bearing mice stained by HE staining, TUNEL staining and CD90 IHC staining assay (the black arrows stand for the tumor tissues; the green arrows stand for the necrosis and collapse of tumor cells; the red arrows stand for the magnetic nanomaterial, the blue arrows stand for the typical apoptosis characteristics), the bar = 200μ m. D. Apoptotic cells in tumor tissues of CD90+ LCSCs-bearing mice (mean ± SD, n = 6). To assess the fraction of apoptotic cells, the count of TUNEL-positive cells was calculated from five sections. **P < 0.05. E. CD90+ cells in tumor tissues after being treated. **P < 0.05. F. Bax and Bcl-2 analysis by western blot. G. Relative density of Bax and Bcl-2. **P < 0.05. Abbreviations: IR, inhibition rate; TMs, thermosensitive magnetoliposomes; CD90, cluster of differentiation 90; HE, haematoxylin-eosin; TUNEL, terminal deoxynucleotidyl transferase-mediated dUTP-biotin nick end labeling; IHC, immunohistochemical.

