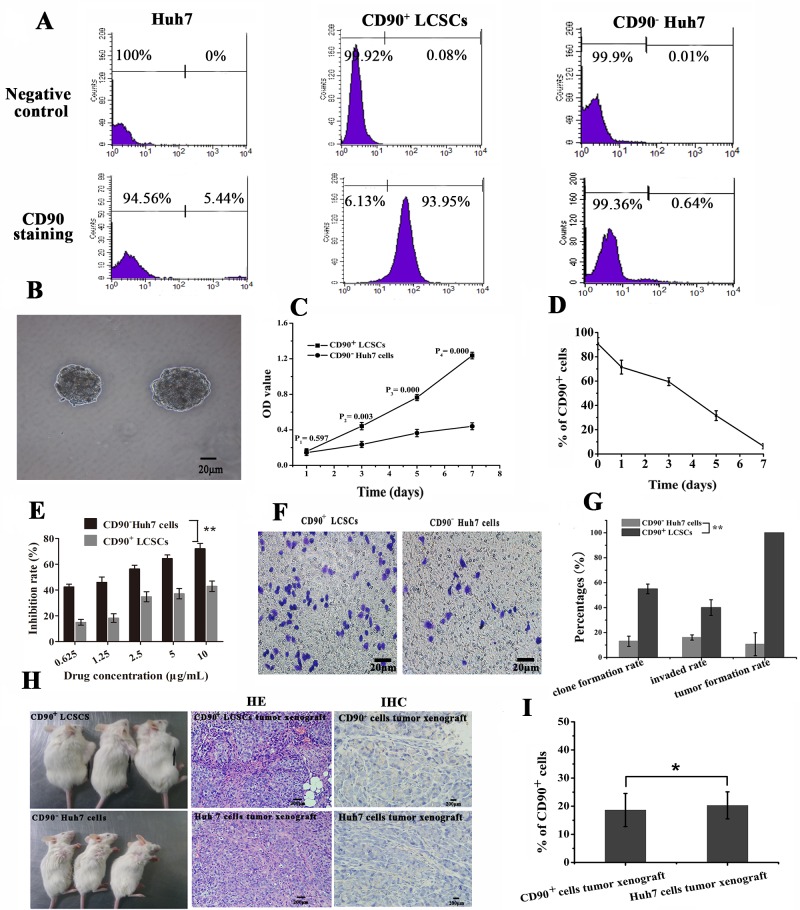
Figure 3. The stem characteristics of LCSCs.
A. The expression rates of CD90 in unsorted, sorted positive and sorted negative cells. B. Morphology of LCSCs spheroids after maintained in DMEM/F12 medium for 7 days (The bar = 20μm). C. Cell proliferation assay (mean ± SD, n = 3). D. Cell differentiation assay (mean ± SD, n = 3). E. Inhibition rate of CD90+ LCSCs and CD90− Huh7 cells observed by CCK-8 assay (mean ± SD, n = 3). F. Invasion assay of CD90+ LCSCs and CD90− Huh7 cells (The bar = 20μm). G. Clone formation rate, invaded rate and tumor formation rate (mean ± SD, n = 3). H. Tumorigenic images of NOD/SCID mice on two month after injection. (The xenografts tumors were marked by black arrow, the bar = 200μm). I. The percentages of CD90+ cells in vivo. **P < 0.05, *P > 0.05. Abbreviations: LCSCs, live cancer stem cells; DMEM/F12, Dulbecco's Modified Eagle Media: Nutrient Mixture F-12; CD90, cluster of differentiation 90; NOD/SCID, nonobese diabetic/severe combined immunodeficien.

