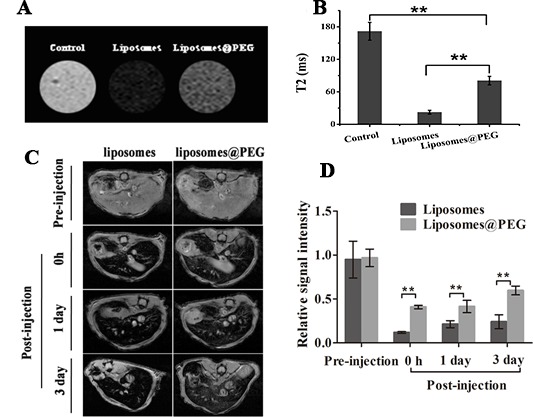
Figure 6. Non-specific uptake experiments in vitro and in vivo.

A. Non-specific uptake assay by RAW264.7 cells in vitro. B. T2 value of the RAW264.7 cells (mean ± SD, n = 3). C. Non-specific uptake assay by liver in vivo. D. Relative signal intensity of the liver. The T2 values were calculated and recorded as the mean ± standard deviation (n = 3). **P < 0.05.
