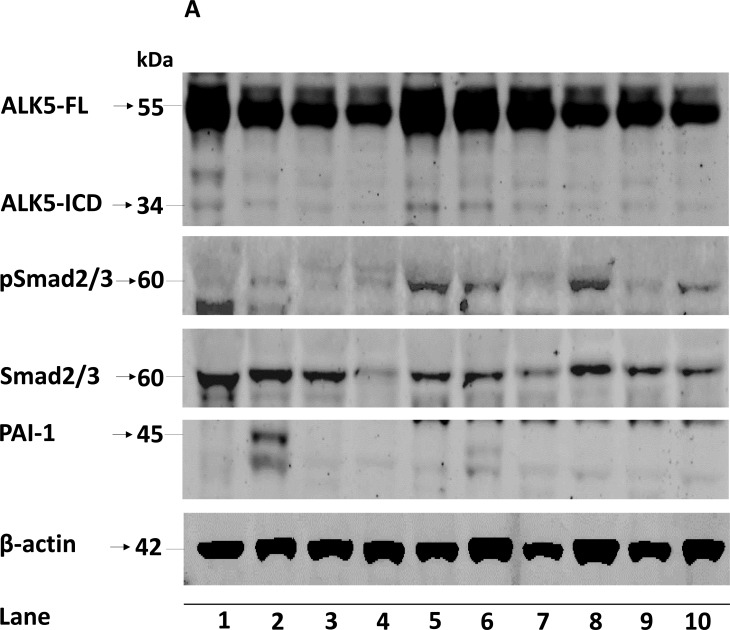
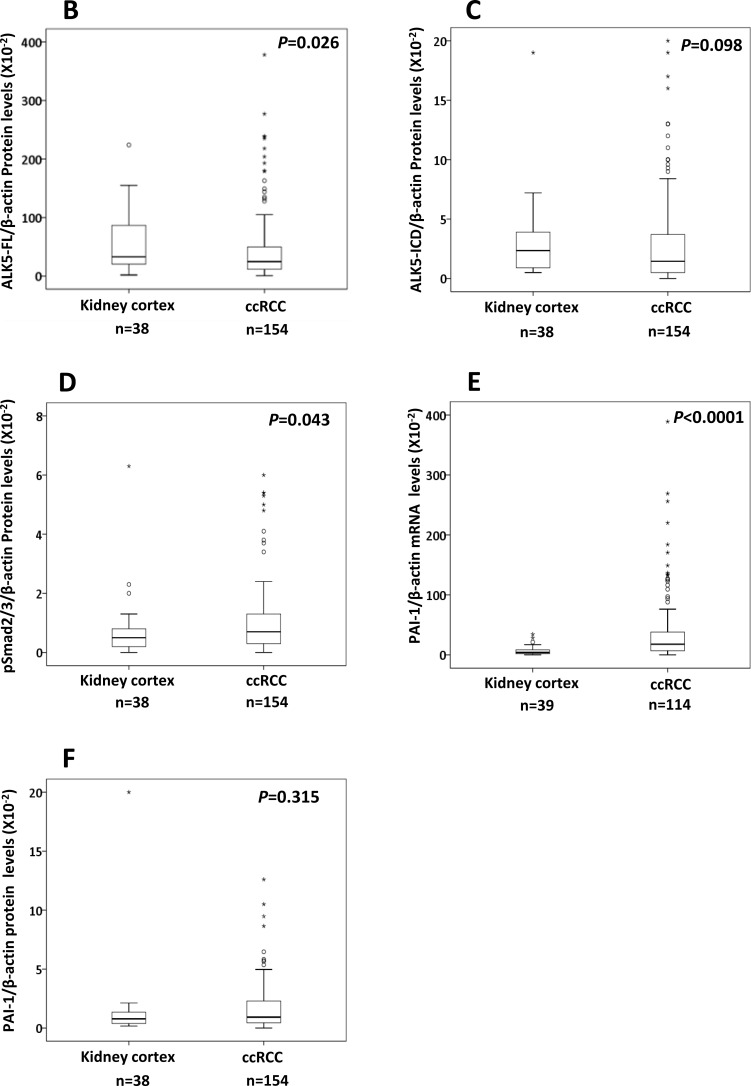
Figure 1.
A. Representative immunoblots (10 out of 154 ccRCC tumor samples loaded in lane 1-10) showing expression of ALK5-FL, ALK5-ICD, pSmad2/3, total Smad2/3 and PAI-1 in ccRCC tissues. β-actin served as internal loading control; Box plot representation of expression of B. ALK5-FL, C. ALK5-ICD, D. pSmad2/3, E. PAI-1 mRNA, and F. PAI-1 protein in the kidney cortex compared with ccRCC tumors (Significant at P < 0.05, Mann-Whitney U-test).


