
Figure 4. Correlation of enrichment scores for early (EGS), intermediate (IGS), late (LGS) and progressive (PGS) gene subsets with in vitro sensitivity to 98 drugs in established squamous cell carcinoma cell lines from the head and neck, esophagus and lung.
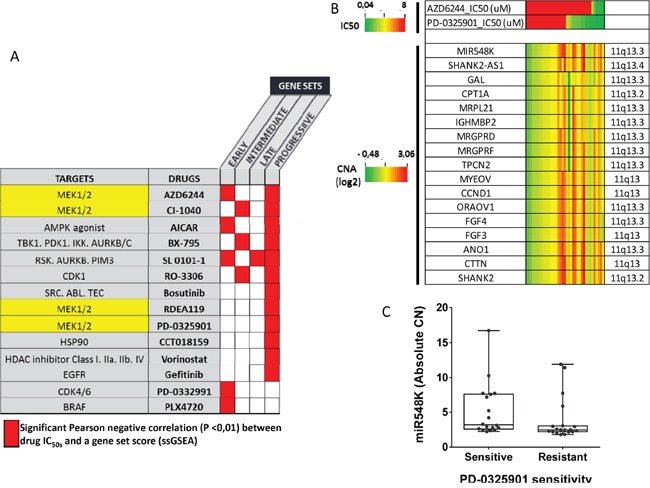
A. Enrichment scores for EGS, IGS, LGS and PGS were computed in 22 head and neck, 23 esophageal SCC and 6 SCC of the lung and correlated with the half maximal inhibitory concentration (IC50) of 98 drugs, downloaded from the GDSC [24]. Most significant negative correlations are shown in red (P<0.01). Main drug target(s) are shown. B. Using data from CCLE [28], we show the association of Copy Number (log2 values) in 11q13 and sensitivity to 2 MEK inhibitors (AZD6244, PD-0325901), in 37 cell lines (5 head and neck, 15 esophageal and 17 SCC of the lung). C. Then, we compared miR548K absolute copy number between sensitive cell lines to PD-0325901 (IC50 <8μM) and resistant cell lines (IC50>8μM). Copy number in miR548 K (region 11q13) is higher in sensitive cell lines (Mann Whitney test, P=0.0421)