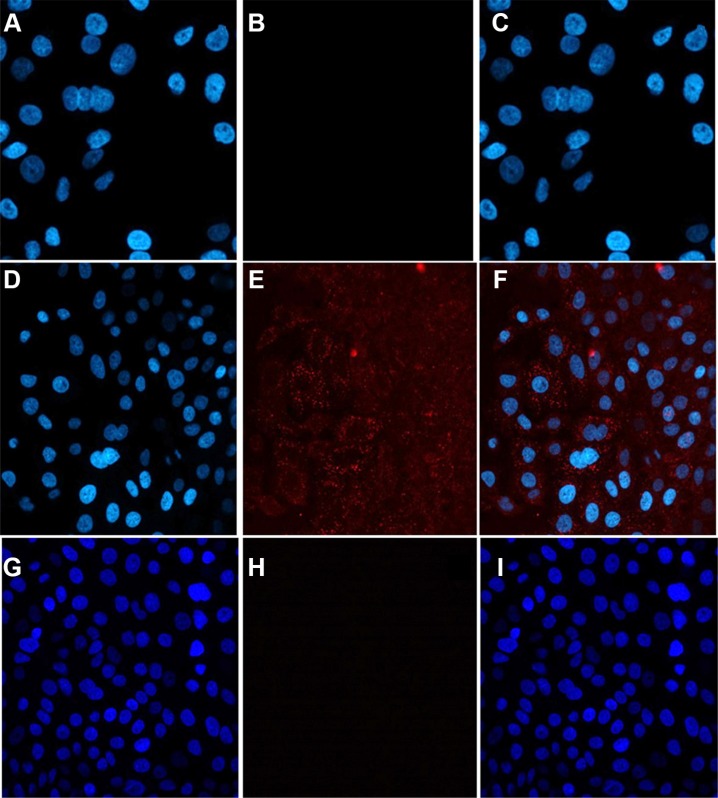
Figure 5. The internalization of compound 7 into A549 cells imaged by confocal microscopy.
The left panel shows only DAPI staining, the middle panel shows only AF647, and the right panel is an overlay of both. Images (A–C) represent PBS control, (D–F) show compound 7, and G-I show compound 5. Image F indicates uptake into cells after 18 hours incubation with 7.

