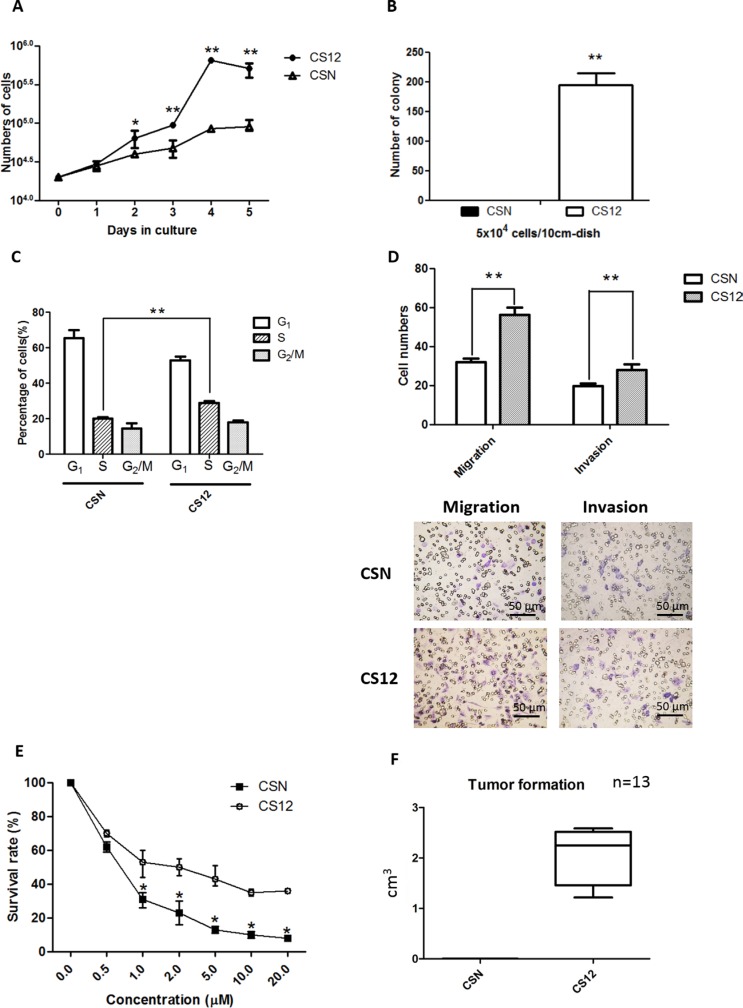
Figure 1. Comparative features of CSN and CS12 cells.
(A) Cell proliferation of CSN and CS12 cells. The mean number of cells (trypan blue dye-exclusion test) was determined for five independent plates. CSN and CS12 cells were starved in MEMα containing 0.1% FCS for 24 h and then replated in MEMα containing 10% FCS and cultured for 5 days. (B) Colony formation of CSN and CS12 cells. Cells were plated in gelatin-coated dishes and colonies with a diameter > 2 mm were counted 2 weeks later. (C) Serum-starved cells were cultured in DMEM containing 10% FCS for 18 h, stained with PI, and subjected to flow cytometric analysis to determine the percentage of cells in each cell cycle. (D) The percentage of invasion and migration was calculated based on the ratio of the number of invading cells vs the total number of CSN and CS12 cells used in inoculation. (E) The drug resistance capacity of CS12 cells was measured as the survival rate of cells when exposed to drug such as 5FU. (F) Tumor sizes with time in SCID mice subcutaneously injected with CS12 cells and CSN normal cells. CS12 cells, not CSN cells, form tumors. Data in A–E were derived from five independent experiments and are presented as mean ± SEM (two-tailed Student t test; *p < 0.05; **p < 0.01).

