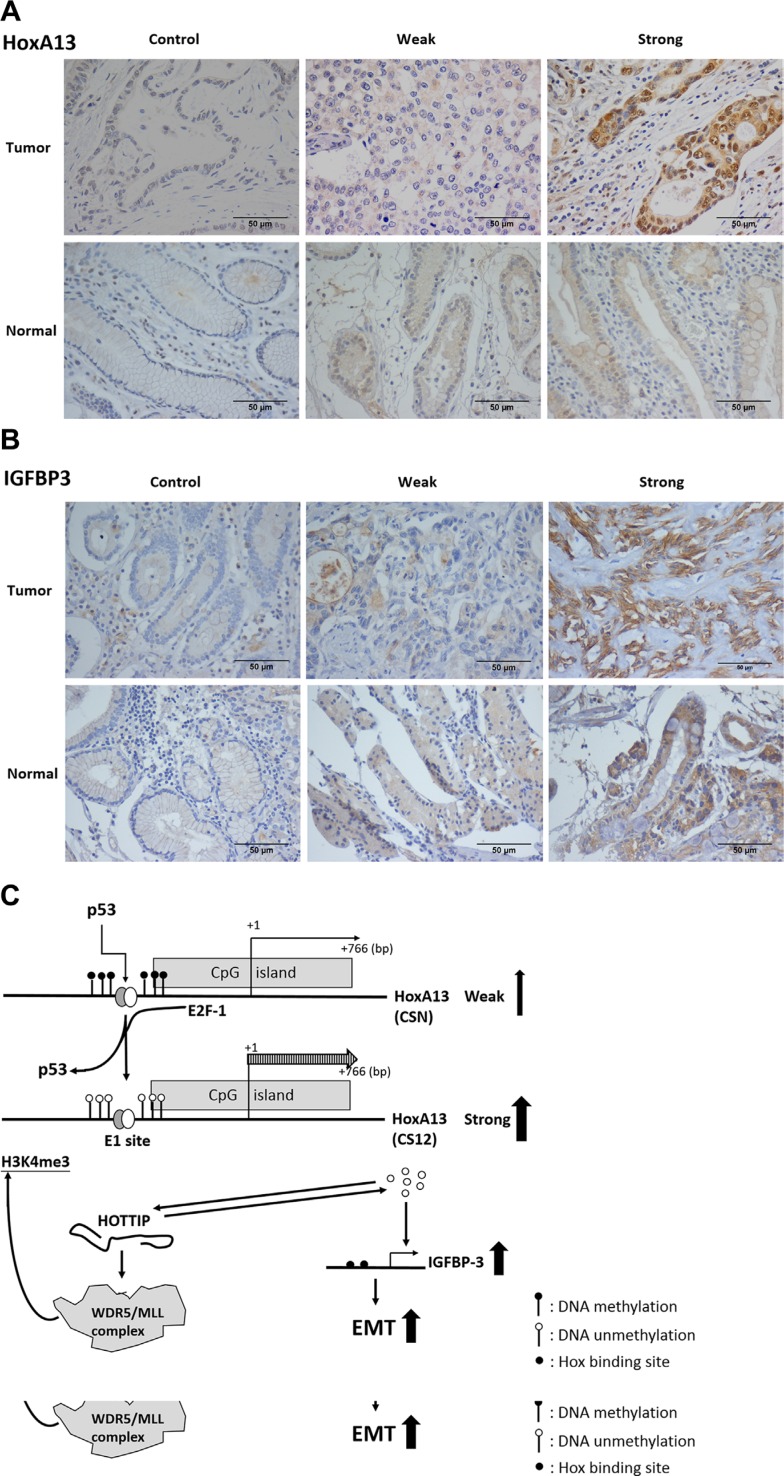
Figure 7. Expression of HoxA13 and IGFBP-3 in specimens of gastric cancer patients.
(A, B) Representative immunohistochemical staining shows strong (score > 4), weak (score < 2) and non (isotype control) expression of HoxA13 (A) and IGFBP-3 (B). (C) Schematic representation of the HoxA13–HOTTIP–IGFBP-3 axis during the development of gastric cancer. EMT: epithelial mesenchymal transition.

