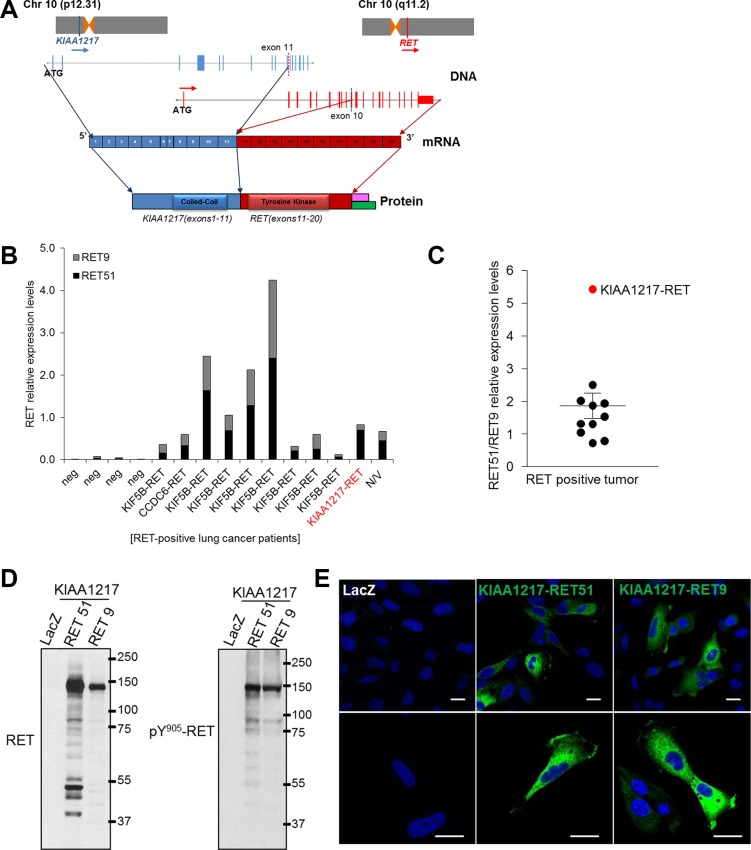
Figure 2. KIAA1217-RET fusion genes.
(A) Schematic representation of the predicted KIAA1217-RET fusion genes identifying the conjoined region in the genome and the transcript by Sanger sequencing. Pink: RET9, Green: RET51, (B and C) Identification of RET isoforms from RET fusion-positive lung cancer patients. (B) The relative mRNA levels of total RET and RET isoforms were analyzed using qRT-PCR and calculated with ΔΔCt values. The values of RET51 and RET9 shown in the graph are presented as ratios of RET51 and RET9 to total RET mRNA. The values shown represent the average of triplicate experiments. Lung cancer patients not harboring the RET fusion are labeled as “neg”, and “N/V” denotes a RET-fusion-positive patient in which a partner gene was not identified (C) The RET51/RET9 relative expression levels were presented as fold changes of relative ΔΔCt values obtained from qRT-PCR and each dot represents relative ratio of RET51/RET9 mRNA expression per patient with RET fusion. (D) The KIAA1217-RET51 or KIAA1217-RET9 fusion gene produces chimeric protein and constitutively activates signaling through autophosphorylation. The KIAA1217-RET51 or KIAA1217-RET9 fusion construct was cloned and infected with pLenti-LacZ (negative control), -EML4-ALK (positive control), -KIAA1217-RET51, or -KIAA1217-RET9 virus and stably expressed in BEAS-2B cells. (E) Cellular localization of KIAA1217-RET51 or KIAA1217-RET9 fusion proteins. Transformed BEAS-2B cells were loaded onto pre-coated collagen (10 μg/mL) cover slides and incubated for 18 h. After incubation, cells were fixed and stained with anti-RET. Images were taken at × 400 (upper panel) and 800 × (lower panel) magnification. Scale bars represent 20 μm.

