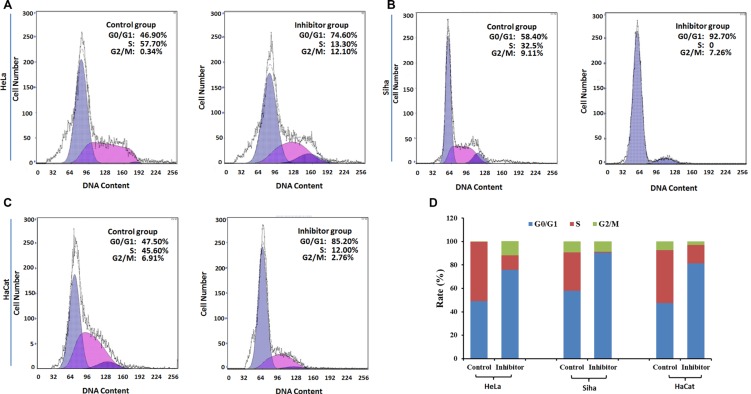
Figure 7. The effect of inhibitor No. 16 on cell cycle progression in HeLa, Siha, and HaCaT cells.
(A), (B) and (C) Graphs showing cell cycles. Compared with control cells, the ratio of G0 phase cells increased in inhibitor groups, p = 0.0004 for HeLa, p < 0.0001 for Siha, p = 0.0001 for HaCaT (D). In contrast, the ratio of S phase cells decreased in inhibitor groups, p = 0.0012 for HeLa, p = 0.0004 for Siha, p = 0.001 for HaCaT.

