
Figure 4. PI3K/Akt/Rac1 signaling pathway mediates EGF-induced SOCE dependent cell migration via P-STIM1.
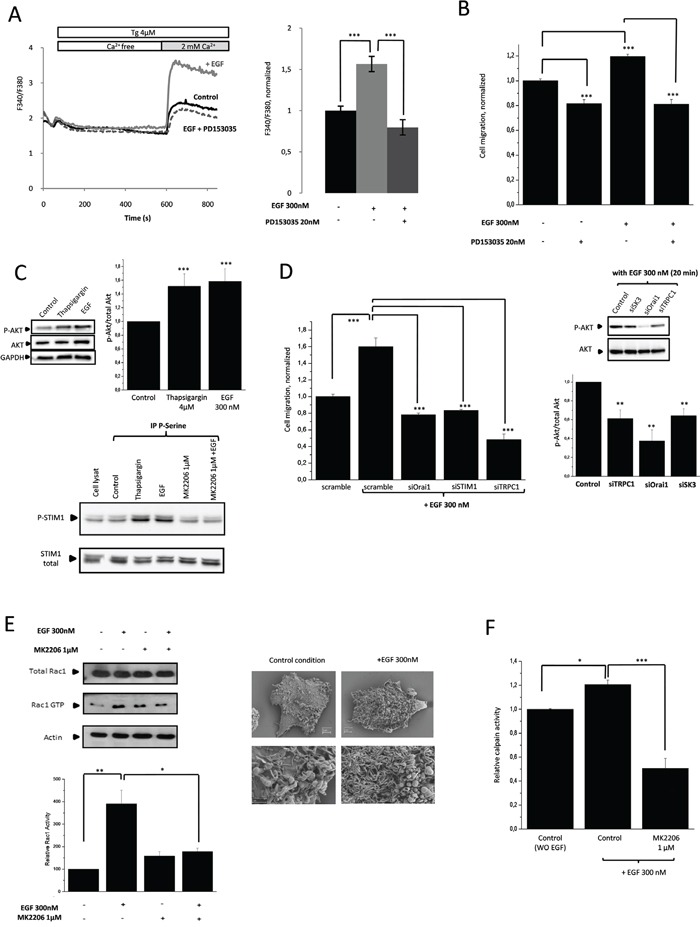
A. Increased of SOCE induced by EGF is inhibited by PD153035. Fluorescence measurement and relative fluorescence of Ca2+entry after intracellular calcium store depletion by Tg in cells treated for 20min with EGF +/− PD153035. Results are expressed as mean ± SEM. ***p<0.001, sample significantly different from control (N=4, Kruskal-Wallis test). B. Increased of cell migration induced by EGF is inhibited by a selective ATP competitive inhibitor of EGFR (PD153035). Histograms showing HCT-116 cell migration with or without treatment by EGF +/− PD153035. Results are expressed as mean ± SEM. ***p<0.001, sample significantly different from control (N=3, n=7, Kruskal-Wallis test). C. Upper panel, EGF treatment and depletion of intracellular calcium store by Tg increase P-Aktin HCT-116 cells. Immunoblots representing P-Akt and total Akt in cells treated or not with EGF or Tg for 20min. P-Akt levels (standardized based on total Akt) was determined by densitometry scanning to generate the values shown in the bar graph. Results are expressed as mean ± SEM. ***p<0.005, sample significantly different from control (N=3, Kruskal-Wallis test). Lower panel, increase of SOCE induces by EGF appears to be linked to STIM1 phosphorylation by Akt. HCT-116 cells are treated with EGF +/− MK2206 or Tg. Serine-phosphorylated proteins were immunoprecipitated, and the presence of STIM1 in the immunocomplexes was detected by western blotting. D. Left panel, Silencing of calcium channels partners prevents SOCE-dependent migration induced by EGF. Results are expressed as mean ± SEM. ***p<0.001, sample significantly different from control (N=2, n=6 Kruskal-Wallis test). Right panel, dissociation of the lipid-raft Orai1/TRPC1/SK3 by siRNA prevents P-AKT increase mediated by EGF. Immunoblots representing P-Akt and total Akt in cells transfected with siRNA for 24h and treated 20 min with EGF.P-Akt levels (standardized based on total Akt) was determined by densitometry scanning to generate the values shown in the bar graph. Results are expressed as mean ± SEM. **p<0.005, sample significantly different from control (N=3, Kruskal-Wallis test). E. Inhibition of Akt by MK2206 decreases Rac1 activity (Rac1 GTP) enhanced by EGF treatment. Left, Upper panel, Immunoblots representing Rac1 GTP and total Rac1 in cells treated or not with EGF for 20min in combination with MK2206. Lower panel, activatedRac1 levels (standardized based on total Rac1) was determined by densitometry scanning to generate the values shown in the bar graph. Results are expressed as mean ± SEM. *p<0.05 and **p<0.01, sample significantly different from control (N=6, Kruskal-Wallis test). Right panel, HCT-116 cells imaged, before and after EGF treatment, using scanning electron microscopy. EGF enhances lamellipodial formation. F. Calpain activity in HCT-116 cells. Inhibition of Akt by MK2206 decreases calpain activity after EGF treatment. Results are expressed as mean ± SEM. *p<0.05 or ***p<0.001, sample significantly different from control (N=4, Kruskal-Wallis test).