
Figure 5. Anti-EGFR mAbs action converge with SOCE-dependent PI3K/Akt pathway involved in HCT-116 cell migration.
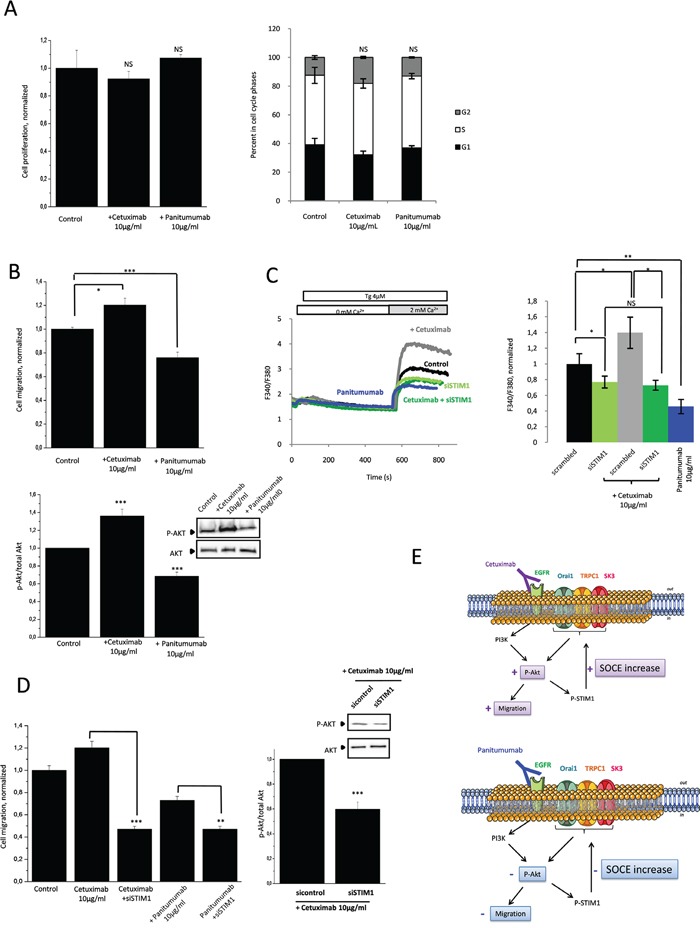
A. Effects of cetuximab and panitumumab on HCT-116 cell proliferation and cell cycle parameters. Left panel, cell viability of mAbs determined with the tetrazolium salt reduction method (MTT). HCT-116 cells were either treated with cetuximab or panitumumab 10μg/mL for 24 h. Right panel, histograms showing effects of cetuximab and panitumumab on cell cycle phases. Results are expressed as mean ± SEM. NS: sample not significantly different from control (N=3, Mann-Withney test). B. Effect of cetuximab and panitumumab on Akt-dependent cell migration. Upper panel, Histograms showing HCT-116 cell migration treated by cetuximab or panitumumab for 24h. Results are expressed as mean ± SEM. *p<0.05 or ***p<0.001, sample significantly different from control (N=3, Mann-Withney test). Lower panel, Immunoblots represent variation of P-Akt expression in HCT-116 cells treated with cetuximab or panitumumab for 24h. P-Akt levels (standardized based on total Akt) was determined by densitometry scanning to generate the values shown in the bar graph. Results are expressed as mean ± SEM. ***p<0.001, sample significantly different from control (N=3, Kruskal-Wallis test). C. Invalidation of STIM1, essential for SOCE, prevented the increase in calcium entry by cetuximab. Fluorescence measurement and relative fluorescence of Ca2+entry after intracellular calcium store depletion by Tg in cells treated for 24h +/− cetuximab and transfected or not with siSTIM1. Results are expressed as mean ± SEM. *p<0.05 or **p<0.01, sample significantly different from control (N=4, Kruskal-Wallis test). Panitumumab decreases SOCE in HCT-116. Fluorescence measurement and relative fluorescence of Ca2+entry after intracellular calcium store depletion by Tg in cells treated for 24h +/− panitumumab. Data are means ± SEM. **p<0.01, sample significantly different from control (N=7, Kruskal-Wallis test). D. Anti-EGFR mAbs actions converge with SOCE-dependent cell migration. Silencing of STIM inhibited the increased of migration enhances by cetuximab and amplifies the anti-migration effect of panitumumab. Left panel, Histograms showing cell migration in presence of cetuximab or panitumumab +/− siSTIM1. Results are expressed as mean ± SEM. ***p<0.001or **p<0.01, sample significantly different from control (N=3, n=9, Kruskal-Wallis test). Right panel, increased of Akt phosphorylation by cetuximab is inhibited by the down-regulation of STIM1. Immunoblots represent expression of P-Akt in HCT-116 cells treated with cetuximab +/− siSTIM1.P-Akt levels (standardized based on total Akt) was determined by densitometry scanning to generate the values shown in the bar graph. Results are expressed as mean ± SEM. ***p<0.001, sample significantly different from control (N=3, Kruskal-Wallis test) E. Proposed mechanism to explain the effects of cetuximab and panitumumabon EGFR signaling pathway and cell migration.