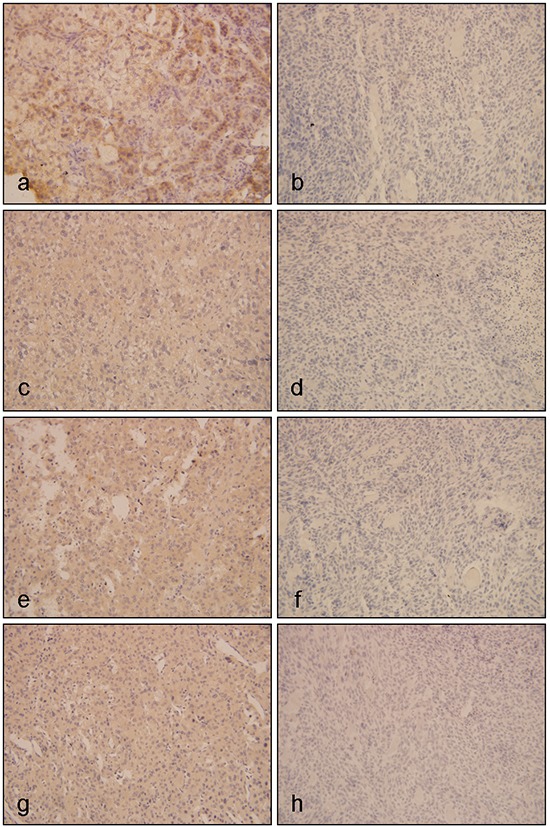
Figure 1. Immunohistochemistical results of EGFR, IGF1R and its downstream proteins in ACTs.

Figure a and b. represented expressions of EGFR in ACTs, of which a was positive expression of EGFR in ACC, and b was negative expression of EGFR in ACA; c and d. represented expressions of IGF1R in ACTs, of which c was positive expression of IGF1R in ACC, and d was negative expression of IGF1R in ACA; e and f. represented expressions of p-ERK in ACTs, of which e was positive expression of p-ERK in ACC, and f was negative expression of p-ERK in ACA; g and h. represented expression of p-mTOR in ACTs, of which g was positive expression of p-mTOR in ACC, and h was negative expression of p-mTOR in ACA. (Original magnification x400)
