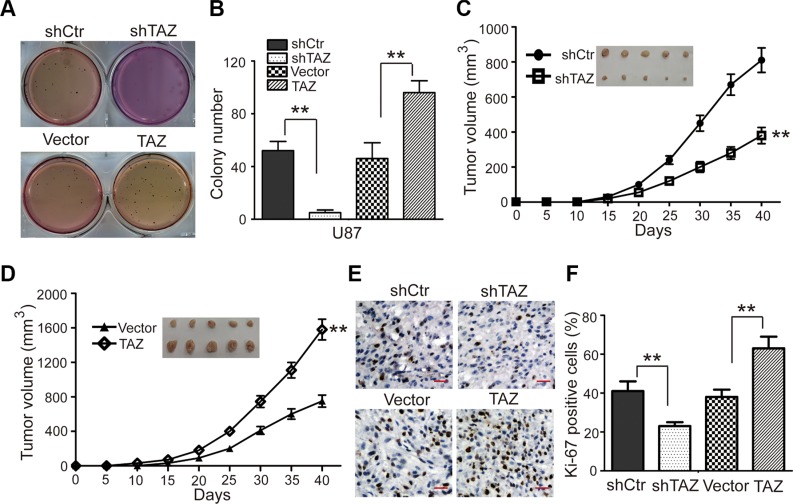
Figure 3. TAZ promotes colony formation and tumor formation of U87 cells in immunodeficient mice.
(A, B) The effects of TAZ on the colony formation in TAZ-knockdown U87 cells and TAZ-overexpressing U87 cells. (C) The tumor growth curve of TAZ-knockdown U87 cells injected into immunodeficient mice. (D) The tumor growth curve of TAZ-overexpressing U87 cells injected into immunodeficient mice. (E) Immunohistochemical staining for Ki67 in tumor tissues, shTAZ: shRNA for TAZ; shCtr: shRNA for control. Values are shown as the mean ± SD. *p < 0.05, **p < 0.01. All p values are based on analysis control versus treatment.

