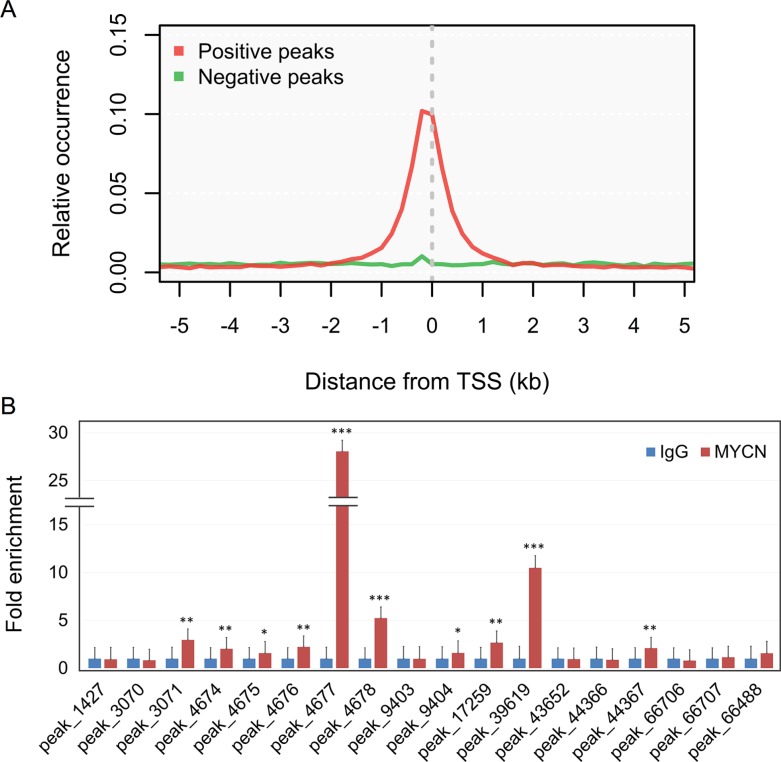
Figure 1. Distribution and validation of MYCN binding sites.
(A) Relative occurrence of MYCN binding peaks per 200-bp bin corresponding to the 5-kb region flanking all annotated TSSs. Positive and negative peaks denote the binding regions with and without other regulatory bindings, respectively, based on the ChIP-seq experiments of the ENCODE project. (B) ChIP-qPCR validation of MYCN binding to genomic regions associated with the promoters of miRNAs or miRNA-hosted genes identified in the ChIP-seq experiment. Ten out of 18 selected sites could be validated by a single gene. Error bars represent SD; n = 3; two-tailed Student t-test: *p < 0.05, **p < 0.01, ***p < 0.001.

