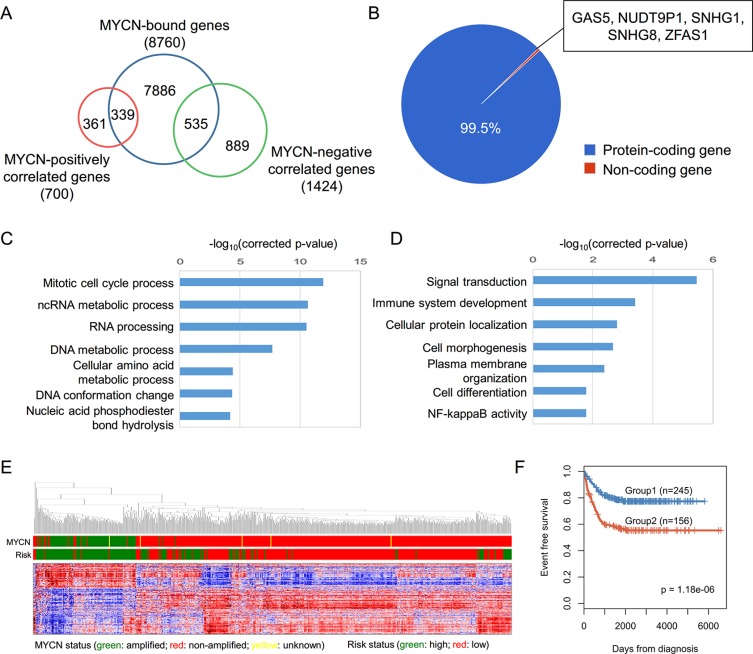
Figure 2. Systematic analysis of MYCN-regulated genes.
(A) Identification of MYCN-regulated genes based on the overlap of MYCN-bound genes and MYCN-correlated genes. (B) Pie chart depicting the percentage of different classes of MYCN-regulated genes. (C, D) GO analysis of MYCN-activated (C) and MYCN-repressed (D) genes. (E) A hierarchical clustering graph representing the association between the expression of MYCN-regulated genes and MYCN, as well as risk status. Data from SEQC RNA-seq are represented as a Pearson correlation metric with average linkage. (F) Kaplan-Meier survival curves of MYCN-non-amplified NB patient groups defined by k-means clustering of expression of 874 MYCN-regulated genes. The graph depicts the p-value as obtained from the Log-rank test. Numbers in parentheses are the number of patients in each group.

