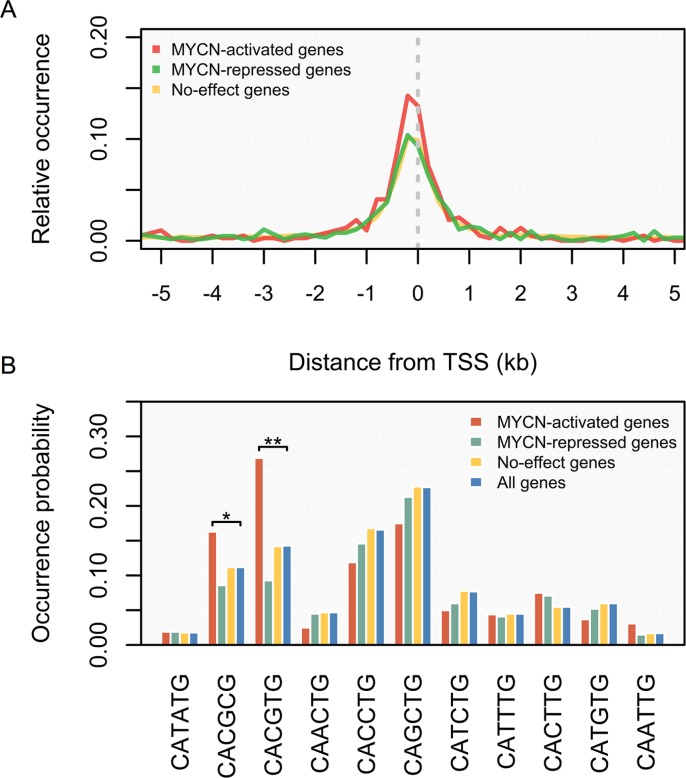
Figure 3. Distribution of MYCN binding and binding E-box sequences according to the direction of regulation by MYCN.
(A) Distance distribution of MYCN binding sites relative to transcription start sites (TSSs). Relative occurrence of MYCN binding peaks per 200-bp bin corresponding to the 5-kb region flanking the TSSs of MYCN-activated genes (red), MYCN-repressed genes (green), and no-effect genes (yellow). (B) Usage of E-box sequences by MYCN. Wilcoxon signed-rank test: *p < 0.05, **p < 0.01.

