
Figure 1. Ectopic MIR126 induces autophagic flux.
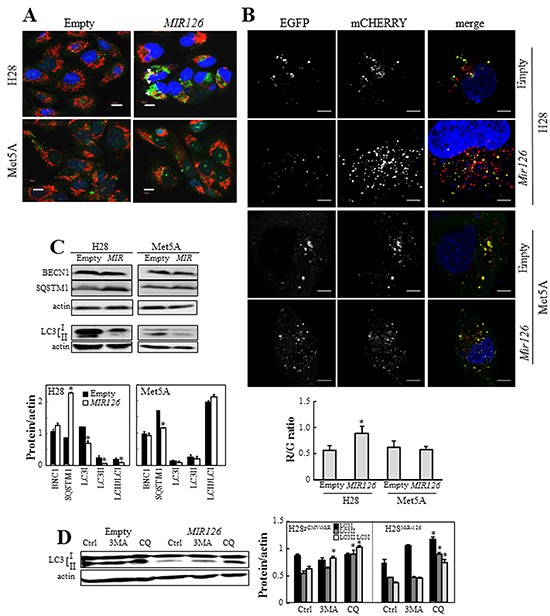
A. MIR126-transfected H28 and Met5A cells and their empty plasmid-transfected counterparts were stained with AO and TMRM, and AVs (green) and mitochondria (red) visualized by fluorescent microscopy. The yellow spots indicate overlaying AVs and mitochondria. Scale bars represent 10 μm. B. MIR126-transfected H28 and Met5A cells and their empty plasmid-transfected counterparts were transiently transfected with dual fluorescence mCHERRY-EGFP-LC3B vector, and the red (R, lysosomal autophagosomes), green (G, autophagosomes) were visualized. Typical cells are shown, scale bars represent 5 μm. Evaluation of the ratio of red/green dots in empty plasmid- and MIR126-transfected H28 and Met5A cells. The number of cells evaluated in each condition was n=56 for H28 and 32 for Met5A, from 5 independent experiments. The symbol “*” indicates significant difference between mock and MIR126 cells. Error bars indicate S.E.M. C. Expression of autophagic markers BECN1, SQSTM1, and LC3I/II. Densitometric evaluation of the bands shown in D related to the level of actin (lower panel). D. Overexpression of MIR126 induces autophagic flux. MIR126-transfected Met5A and H28 cells and their empty plasmid-transfected counterparts were incubated in the presence and absence of 3MA or CQ for 24 h, and evaluated for LC3 conversion. Densitometric analysis of LC3 conversion related to actin (lower panel). The data shown are mean values ± S.D. derived from three independent experiments. Comparisons among groups were determined by one-way ANOVA with Tukey post-hoc analysis; the symbol “*” denotes significant differences compared with empty plasmid-transfected cells, or controls (Ctrl) versus treatments (3MA and CQ), with p < 0.05.