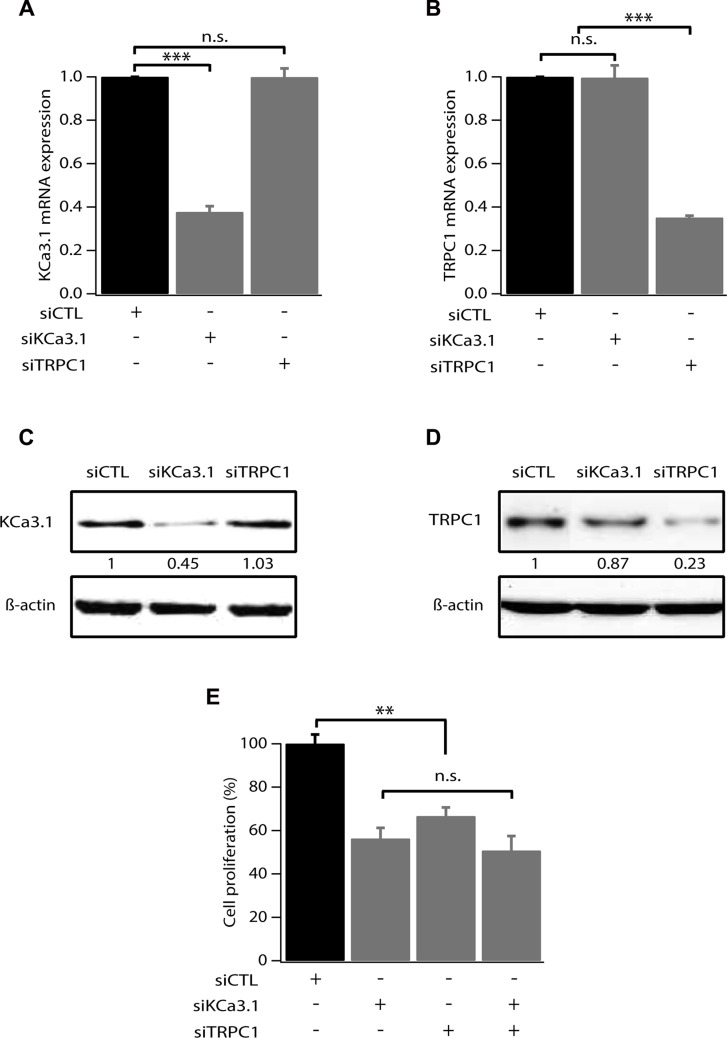
Figure 1. TRPC1 and KCa3.1 involvement in breast cancer cell proliferation.
(A) qRT-PCR analysis of KCa3.1 mRNA expression in MCF-7 cells transfected with scrambled siRNA (siCTL), siRNA directed against KCa3.1 (siKCa3.1), siRNA directed against TRPC1 (siTRPC1). The graph shows KCa3.1 mRNA expression normalized to β-actin mRNA expression (n = 4). (B) qRT-PCR analysis of TRPC1 expression level in MCF-7 cells transfected with siCTL, siKCa3.1 or siTRPC1. The graph shows TRPC1 mRNA expression normalized to b-actin mRNA expression (n = 4). (C) Representative western blot showing the effect of siRNAs directed against KCa3.1 and TRPC1 on the protein level of KCa3.1. (D) Representative western blot showing the effect of siRNAs directed against KCa3.1 and TRPC1 on the protein level of TRPC1. (E) Analysis of MCF-7 cell proliferation transfected with siCTL, siKCa3.1, siTRPC1 or both siKCa3.1 and siTRPC1. Cell proliferation is measured 72 h post-transfection. Values are reported as mean ± SEM normalized to the control (n = 4). **p < 0.01, ***p < 0.001, n.s.: not significant.

