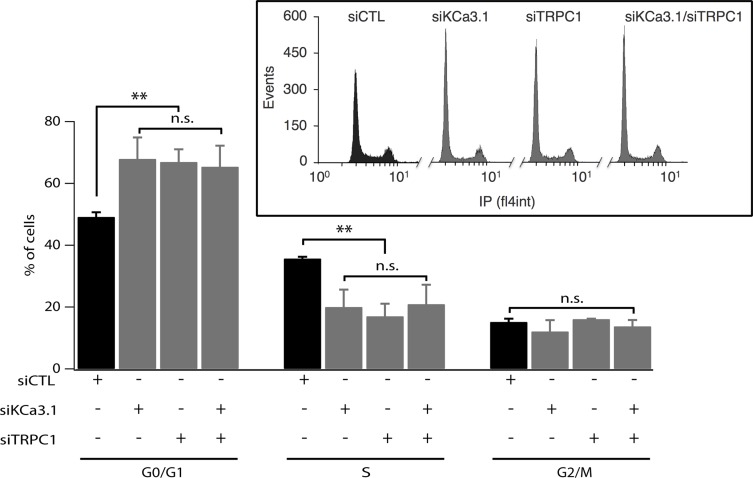
Figure 2. Silencing of TRPC1 and KCa3.1 expression induces accumulation of cells in G1 phase.
MCF-7 cells were transfected using Amaxa with either control siRNA (siCTL), KCa3.1 siRNA (siKCa3.1), TRPC1 siRNA (siTRPC1) or both TRPC1/KCa3.1 siRNAs (siTRPC1/siKCa3.1), and then cultured in EMEM medium with 5% FBS for 72 h. After staining with propidium iodide, cell cycle distribution (G0/G1, S and G2/M phases) was examined by flow cytometry. The graph represents the percentage of cells in different phases under control condition or KCa3.1 or TRPC1 knockdown conditions (n = 3). Insets show raw data from the FACS acquisition software. Values are reported as mean ± SEM. **, p < 0.01, n.s.: not significant.

