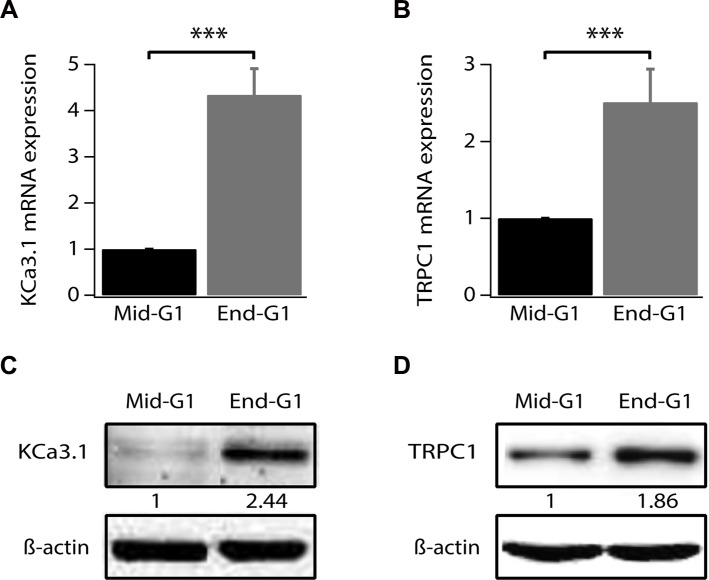
Figure 3. TRPC1 and KCa3.1 upregulation during G1 phase progression.
(A) qRT-PCR analysis of KCa3.1 mRNA expression level in synchronized cells. (B) qRT-PCR analysis of TRPC1 mRNA expression level in synchronized cells. (C) Representative western blot showing the expression level of KCa3.1 in synchronized cells. (D) Representative western blot showing the expression level of TRPC1 in synchronized cells. Cell synchronization was achieved by 24 h treatment of cells by either serum- and phenol red-free medium (mid-G1) or by complete medium supplemented with 2 mM thymidine (end-G1). Values are reported as mean ± SEM normalized to control. ***p < 0.001.

