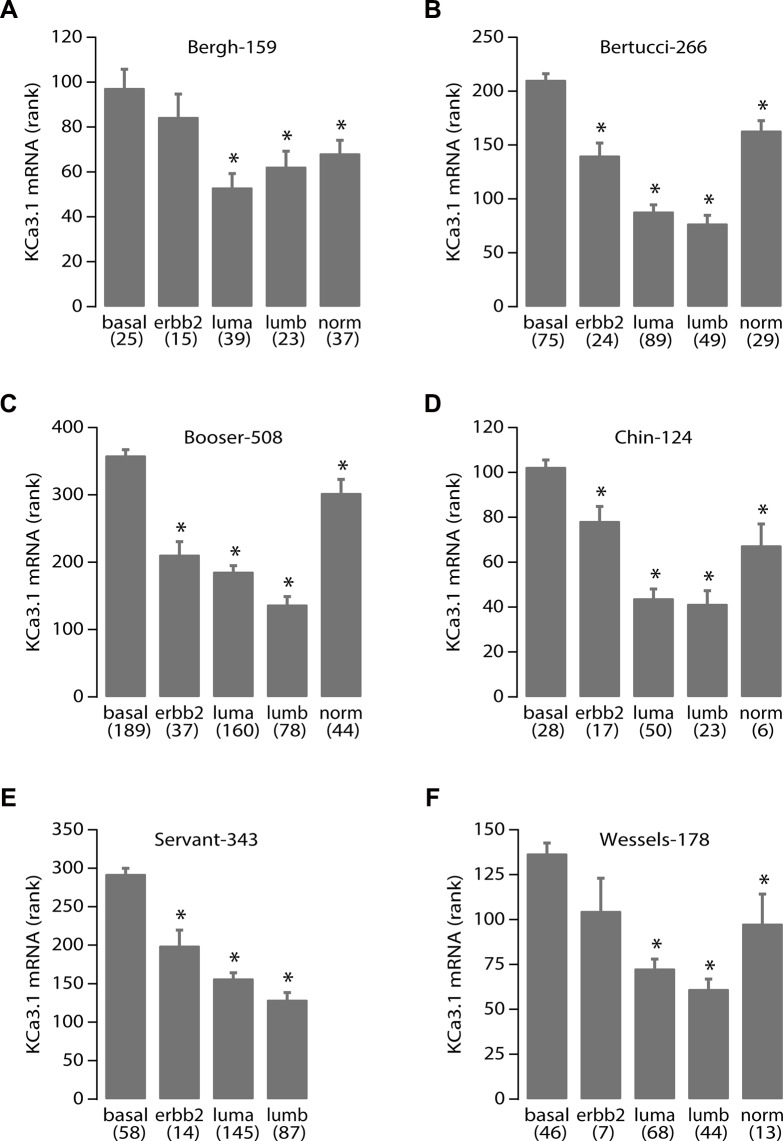
Figure 7. High KCa3.1 expression correlates with the basal breast cancer subtype.
KCa3.1 tumor mRNA expression correlation with breast cancer molecular subtypes. Panels A-F represent the results from all 6 breast cancer datasets in the public domain that contain data on breast molecular subtypes: Bergh-159 (GSE1456), Bertucci-266 (GSE21653), Booser-508 (GSE25066), Chin-124 (E-TABM-158), Servant-343 (GSE30682), and Wessels-178 (GSE34138), respectively. Below the graph are the different subtypes: basal-like (basal), Her2/Neu/ERBB2 over-expressing (erbb2), luminal-a (luma), luminal-b (lumb) and normal-like (norm) according to [31], between brackets are the number of samples per subtype. Vertical bars represent the S.E.M. The Servant-343 set did not contain samples of the “normal” subtype. More data on the sets are in Table 1 and its legend. Statistical analysis was performed using the non-parametric Kruskal-Wallis test. *denotes significant differences with the basal subtype expression (all p < 0.005).

