
Figure 10. Expression levels of CDK5 and related markers in renal biopsies of DN patients and relationship with renal fibrosis.
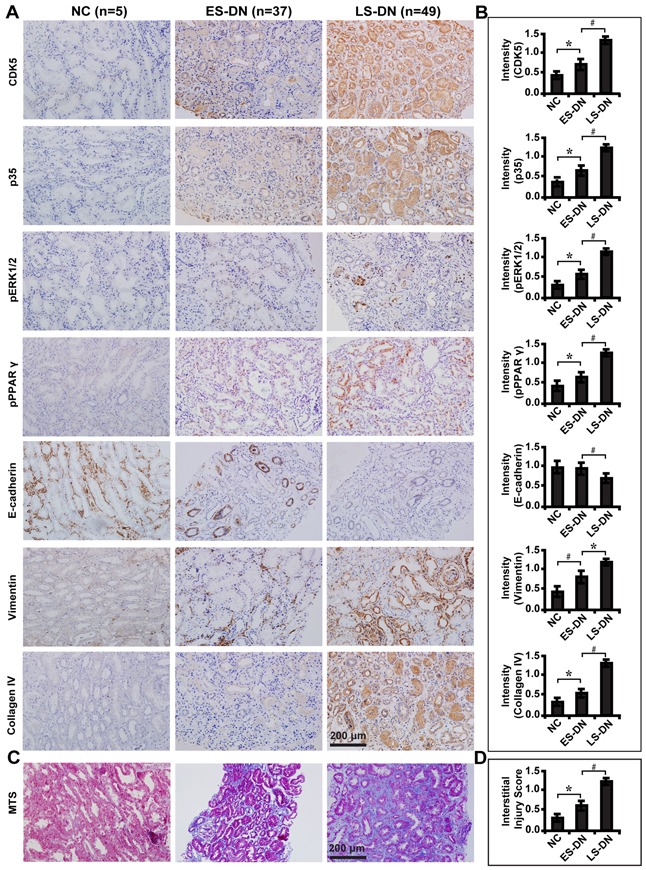
A. Immunohistochemical staining of CDK5, p35, phosphorylated ERK1/2 and PPARγ, E-cadherin, Vimentin and Collagen IV in ES-DN (n=49), LS-DN (n=37) and NC (n=5). B. Quantification of the staining intensity compared between groups. C. Deteriorated TIF in LS-DN compared with ES-DN and NC by MTS and D. interstitial injury score compared between groups. Results are presented as mean ± SD of three independent experiments. *P<0.05, #P<0.001. NC, normal controls; ES-DN, early staged diabetic nephropathy; LS-DN, late staged diabetic nephropathy; TIF, tubulointersitial fibrosis; MTS, Masson's trichrome stain.