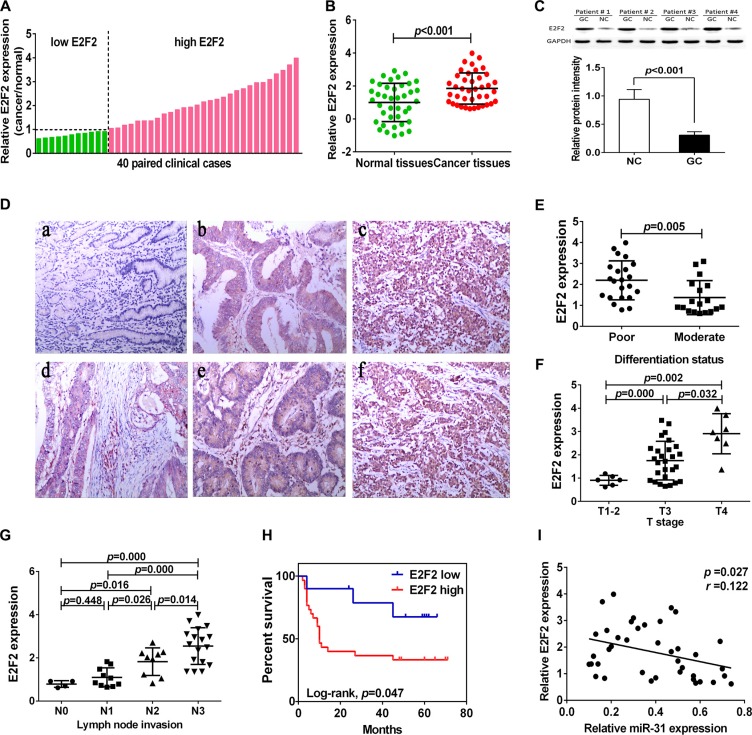
Figure 5. Upregulation of E2F2 expression in gastric cancer tissues.
(A, B) qRT-PCR analysis of E2F2 expression in 40 pairs of gastric cancer and corresponding normal tissues. Expression of E2F2 protein was normalized to that of β-actin. The level of E2F2mRNA was significantly higher than that of the adjacent tissues. (C) Western blot. Level of E2F2 protein was normalized to GAPDH. (D) Immunohistochemistry. E2F2 protein expression in gastric cancer tissues was analyzed by immunohistochemistry. a, normal gastric tissue; b, moderately differentiated gastric adenocarcinoma; c, poor differentiated gastric adenocarcinoma; d, superficial muscular infiltration; e, serosal layer infiltration; f, whole layer infiltration (all ×100). (E) Expression of E2F2 protein in different differentiation status of gastric cancer. (poorly differentiated = 22, moderately differentiated = 18). (F) Expression of E2F2 in different T stage (depth of cancer invasion) of gastric cancer, including T1–2 (mucous and muscular layer) 6 cases, T3 (serosal layer) 27 cases and T4 (whole layer) 7 cases. (G) Expression of E2F2 in different N stage (lymph node metastases) of gastric cancer (N0 = 4, N1 = 10, N2 = 9, N4 = 17). (H) Kaplan-Meier curve of overall survival of gastric cancer patients with high (n = 29) vs. low (n = 11) E2F2 levels (p = 0.047). (I) Comparison of miR-31 with E2F2 level in gastric cancer (r = 0.122, p = 0.027).

